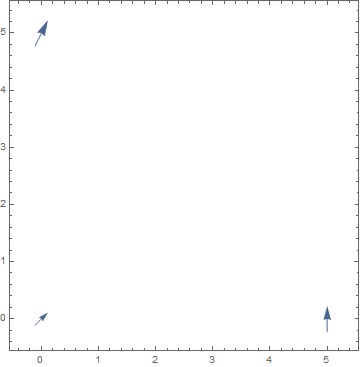
I have always found ListVectorPlot confusing and dysfunctional. It really wants a data set that it can consider to be sampled points in a continuous field. It then interpolates and plots a representation of the field, but not necessarily at the sampled points. The documentation says that VectorPoints->All will cause it to plot at the given points, rather than interpolate. But even then it seems to want a dataset that is a qualified representative of a continuous field. There does not seem any way to tell it to forget about the need to interpolate -- just plot the points given. Below there are three vectors. But if given only one you will get an error that it is not a valid vector field dataset.
ListVectorPlot[{{{5, 0}, {0, 2}}, {{0, 5}, {1, 2}}, {{0, 0}, {1, 1}}},
  VectorPoints -> All]