Quick answer:
Evaluate @ Table[
  Sin[l] Piecewise[{
     {250, 0 < l < ArcCos[(d^2 + 75)/(20 d)]},
     {2500/Sqrt[100 + d^2 - 20 d Cos[l]] - 250,   l > ArcCos[(d^2 + 75)/(20 d)]}}],
  {d, 5, 15, 2}]
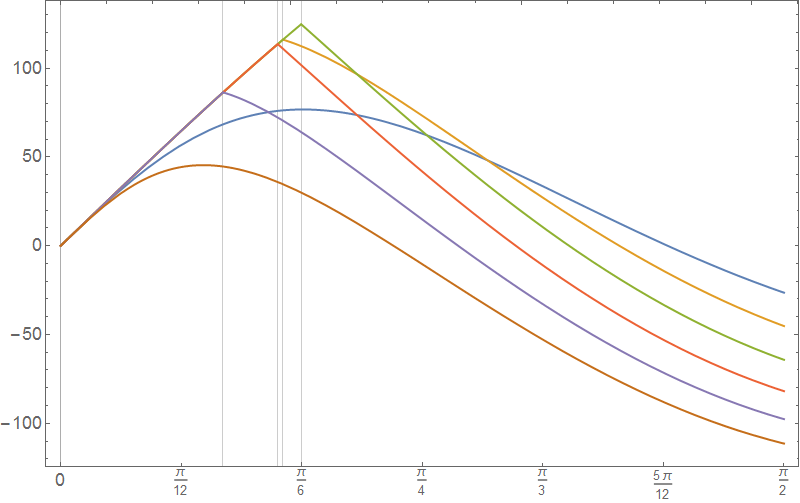
Basic answer:
Plot[     Evaluate@ Table[Sin[  l] Piecewise[{{250,   0 < l < ArcCos[(d^2 + 75)/(20 d)]}, {2500/   Sqrt[100 + d^2 - 20 d Cos[l]] - 250,
       l > ArcCos[(d^2 + 75)/(20 d)]}}], {d, 5, 15, 2}],
 {l, 0, Pi/2},
 PlotRange -> All, ImageSize -> 800, Axes -> False, Frame -> True,
 FrameTicks -> {{Automatic, Automatic}, {Range[0, Pi/2, Pi/12],     Automatic}},
 GridLines -> {Table[ArcCos[(d^2 + 75.)/(20 d)], {d, 5, 15, 2}], {}},   PlotStyle -> Thick, BaseStyle -> 18]
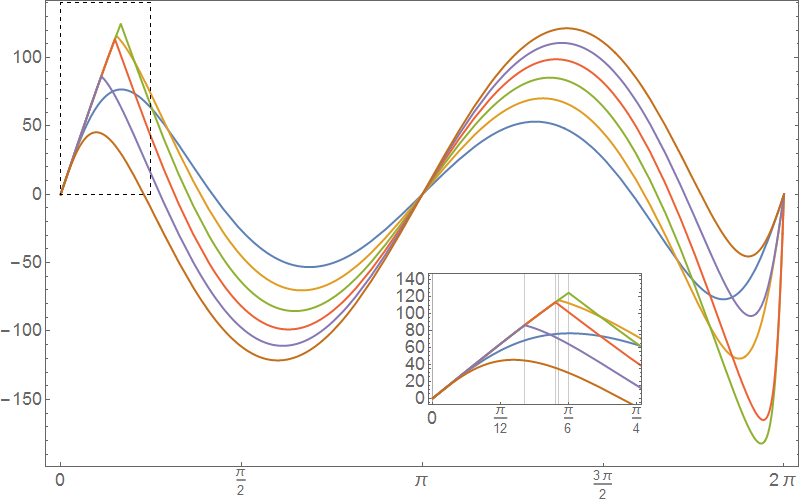
 Extended answer:
Plot[   Evaluate@Table[    Sin[l] Piecewise[{  {250, 0 < l < ArcCos[(d^2 + 75)/(20 d)]},
       {2500/Sqrt[100 + d^2 - 20 d Cos[l]] - 250,   l > ArcCos[(d^2 + 75)/(20 d)]}}],   {d, 5, 15, 2}],
  {l, 0, 2 Pi},
  PlotRange -> All, ImageSize -> 800, Axes -> False, Frame -> True,
  FrameTicks -> {{Automatic, Automatic}, {Range[0, 2 Pi, Pi/2], None}},
  PlotStyle -> Thick,    BaseStyle -> 18
  ] //  Show[#, Epilog -> {    {EdgeForm@Dashed, FaceForm@None, Rectangle[{0, 0}, {Pi/4, 140}]},
           Inset[
            Show[#, PlotRange -> {{0, Pi/4}, {0, 140}}, ImageSize -> 250,
             FrameTicks -> {{Automatic, Automatic}, {Range[0, Pi/4, Pi/12],
                None}},
             GridLines -> {Table[
                ArcCos[(d^2 + 75)/(20 d)], {d, 5, 15, 2}], {}}],
            ImageScaled[{.65, .3}]]
           }] &