I'm working with this chart:
DateListPlot[{({{#[[1]]}, #[[2]]} & /@ revenues) /.
   Rule -> List, ({{#[[1]]}, #[[2]]} & /@ profits) /. Rule -> List,
  MapIndexed[{{revenues[[#2[[1]], 1]]}, #1} &,
   Table[revenuemodel["BestFit"], {x, 1, Length[yearrange]}]],
  MapIndexed[{{profits[[#2[[1]], 1]]}, #1} &,
   Table[profitmodel["BestFit"], {x, 1, Length[yearrange]}]]},
 Joined -> {False, False, True, True},
 PlotLegends -> {"Revenue", "Profit"},
 FrameLabel -> {{"USD ($)", None}, {"Year", None}},
 PlotLabel -> "Revenue and Profit of " <> "IBM" <> " Over Time",
 PlotTheme -> "Business"]
It makes a DateListPlot with unjoined datapoints for revenue and profit, and two joined lines for the linear model of each, like this:
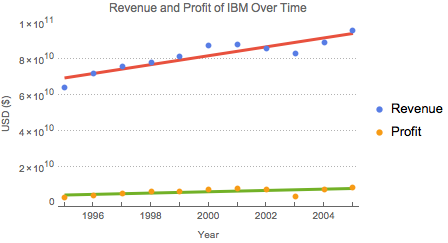
All the variables are properly defined prior to evaluation.
However, when I put the same chart in a NotebookTemplate, with all the variables replaced with NotebookTemplateSlots, the second trendline isn't rendered:
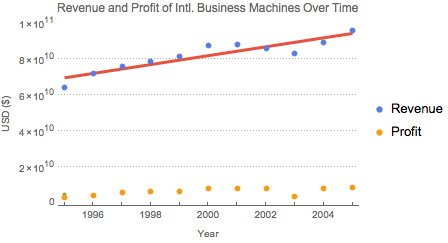
Note, however, that there is a dot at the place where the trendline starts, and further investigation indicates that this is in fact a very short line, only at that point. As the chart renders properly outside of the template, I think this is most likely a bug. I will continue investigating, though. There might be a problem with my data.


