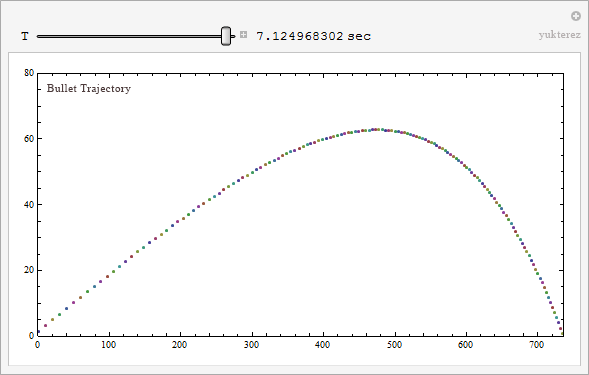
When I evaluate my .nb file on version 9, it looks like this:
when I evaluate the same code on version 10, I get much too big and colored points:
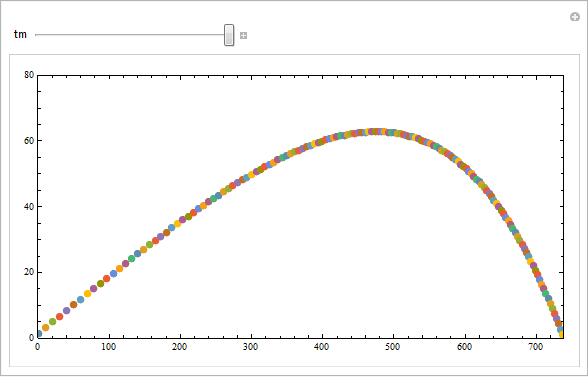
I like the older styling much more than the newer one, but I can't figure out which command to tell version 10 to plot like version 9. The plot command which I use that brings different styles on different versions is:
ListPlot[Table[{Flatten[Evaluate[{rx[t] /. sol, ry[t] /. sol}]]}, {t, tMin, tMax, 0.05}]]
The point size in the Plot also changes when I change the step size (here 0.05) in version 10...
Confused,
Y.


