Message Boards Message Boards

0
|
4047 Views
|
2 Replies
|
1 Total Likes
View groups...
Share
Share this post:

How to put labels on points on an x-y plot?

Posted 10 years ago

I have a set of x-y data points, and each point has a reference index. These could be in a list as follows:

ixy := {{i1,x1,y1},{i2,x2,y2}, ..., {in,xn,yn}} E.g., x-y point x2,y2 has index i2.

I'd like to use ListPlot or any other plotting function to plot the x-y values, and at each point show the index in say a circle. From the documentation, I can see how to put a circle (or other symbol) at any point, but I can't find a function to put the index or any arbitrary label.

I'd also like to be able to connect particular points with a line segment.

Thank you for your consideration and advice.

POSTED BY: Dale Bent
2 Replies

Thank you very much, David. Just what was needed. Dale B.

POSTED BY: Dale Bent

Generate an indexed set of random points.

points = Table[{i, RandomInteger[{1, 10}],  RandomInteger[{1, 10}]}, {i, 10}]
{{1, 3, 7}, {2, 3, 2}, {3, 7, 3}, {4, 4, 4}, {5, 3, 10}, {6, 3, 10}, {7, 9, 2}, {8, 8, 1}, {9, 2, 9}, {10, 8, 7}}

Here is a routine to plot a point:

pointPlot[{index_, x_, y_}] := {Circle[{x, y}, Offset[8]], Text[index, {x, y}]}

Here is a plot:

Graphics[{pointPlot /@ points},
 PlotRange -> All,
 PlotRangePadding -> 1/2,
 Frame -> True,
 ImageSize -> 300]
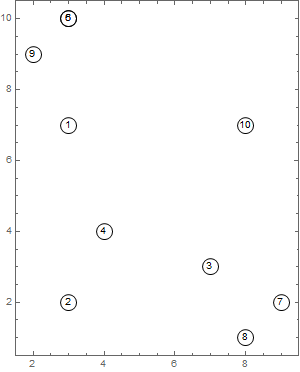
enter image description here

Offset specifies a size for the Circle in printers points so it will not be affected by AspectRatio. You could embellish the representation in various ways. Perhaps modify the routine to only require the index values. I'll leave it to you to write a routine to draw a line between specific points.

Reply to this discussion
Community posts can be styled and formatted using the Markdown syntax.
Reply Preview
Attachments
Remove
or Discard

Group Abstract Group Abstract