Doing this is a bit harder than you'd think at first. Dates are harder to work with than numbers. Normally, I'd suggest converting all dates to numbers using the AbsoluteTime function first, but here I'll show you how I would do this in Mathematica 10.
First, let's use the TimeSeries data structure. This marks your data as a time series and makes sure Mathematica knows to interpret your data as a series of values over time.
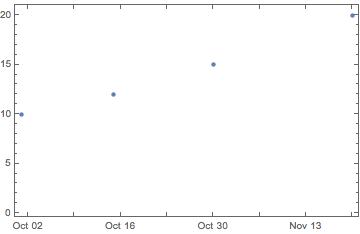
data = TimeSeries[{{{2006, 10, 1}, 10}, {{2006, 10, 15}, 12}, {{2006, 10, 30}, 15}, {{2006, 11, 20}, 20}}];
DateListPlot[data, Joined -> False]
Great. It recognizes your data as being dates. Let's use LinearModelFit to get a linear fit and then use normal to extract out the equation:
lm = Normal[LinearModelFit[data, x, x]]
We want to plot it, but ... the plotting function needs numbers.... It has to know what range of values to plot over and those have to be numbers. They can't be dates. The function that converts from dates to numbers appropriately is called AbsoluteTime:
fitPlot = Plot[lm, {x, AbsoluteTime[{2006, 10, 1}], AbsoluteTime[{2006, 11, 20}]}, PlotStyle -> Red]
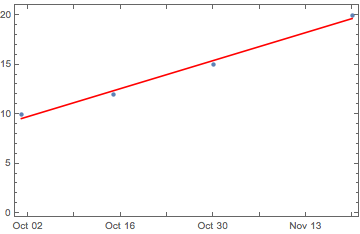
Now we can join our plots together:
Show[DateListPlot[data, Joined -> False], fitPlot ]