Message Boards Message Boards

0
|
14192 Views
|
7 Replies
|
4 Total Likes
View groups...
Share
Share this post:

Strange IRR results

Posted 9 years ago

I am trying to calculate the IRR over time for a series of values. I am seeing weird results in 1 or 2 of the values. I have created a notebook which shows what I am experiencing - here's the output... the 3rd and 7th value is wrong. What am I doing wrong?

-92.6077 -87.2071 -117.452 -76.0161 -70.8105 -65.9989 -135.724 -57.5769 -53.9218 -50.5947 -47.5632 -44.7965 -42.2667 -39.949 -37.8211 -35.8634 -34.0589 -32.3926 -164.534 -29.4238 -28.0997 -26.8701 -25.7268 -24.6627 -23.6714 -22.7472 -21.8852

Attachments:
POSTED BY: Tim Heger
7 Replies

You should always plot a graph when doing any solving type activity. Some of your equations have two solutions as I alluded to before. When you use find root you will get one of them and this may not be the same one excel gets. Use solve to get both. Sometimes you can also get multiple solutions if you have alternating cash flows and most introductory finance texts note this as one of the drawbacks of internal rate of return.

Solve[TimeValue[Cashflow[values[[1 ;; 7]]], r, 0] == 0, Reals]

{{r -> -1.25357}, {r -> -0.724255}}

Check both of your answers.

TimeValue[Cashflow[values[[1 ;; 6 + 1]]], r, 0] /. {r -> -1.2535683433939733`}

TimeValue[Cashflow[values[[1 ;; 6 + 1]]], r,  0] /. {r -> -0.7242552925326607`}

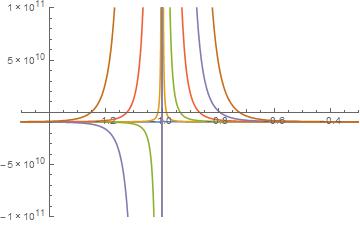
Plot the NPV. There are two solutions for some of the NPV curves.

NPV[i1_] := TimeValue[Cashflow[values[[1 ;; i1 + 1]]], r, 0];
curves = Map[NPV[#] &, Range[1, 6]];
Plot[curves, {r, -1.5, 0.3}, 
 PlotRange -> {{-1.5, -0.3}, {-100000000000, 100000000000}}]

enter image description here

POSTED BY: Emerson Willard
Posted 9 years ago

I completely agree that the sample data set I created would be a horrible investment that no one should take on but at the end of the day it's just a math problem and Mathematica is providing the wrong answers. Why? Excel can calculate this without giving wrong answers so I would assume Mathematica should be able to also.

POSTED BY: Tim Heger

All your internal rates of return are negative. Mathematically speaking, Mathematica is giving you the correct solutions. In fact it even gives you multiple solutions. Unless you are a central banker these negatives rates don't really make sense even in the current deflationary environment so you might want to constrain your solutions

Solve[TimeValue[Cashflow[values], r, 0] == 0 && r > 0, r, Reals]

If you use your first 11 cash flows you gets solutions of -144% and -51% and if you plot the present value it approaches infinity as r approaches -100%. I guess if your current holdings are to become worthless in the next period then promise of $1 at that time would sound quite attractive.

POSTED BY: Emerson Willard

IRR - Internal Rate Of Return ??

POSTED BY: Bruce Miller
Posted 9 years ago

Yes - looking to calculate the rolling IRR.

POSTED BY: Tim Heger

The main problem you are having is financial because the cash flows don't cover the initial outlay. Your initial negative cash flow is far too large and you need to remove three zeros before you will get any sensible answer. Evaluate the following to see whether your deal makes sense.

pv1 = TimeValue[Cashflow[values], r, 0];
Plot[pv1, {r, 0, 0.3}]

Also, I would avoid using Do and Print and instead create a function and then use Table to get your different IRR's.

irr3[i1_] :=  FindRoot[TimeValue[Cashflow[values2[[1 ;; i1 + 1]]], r, 0] == 0, {r, .05}];
Table[{i, irr3[i]}, {i, 1, 30}]
POSTED BY: Emerson Willard
Posted 9 years ago

Thanks for the tip on Do and Print...

Regardless of whether or not it's a good financial deal Mathematica should could up with the right answer. If you change the starting point you get different values being wrong.

POSTED BY: Tim Heger
Reply to this discussion
Community posts can be styled and formatted using the Markdown syntax.
Reply Preview
Attachments
Remove
or Discard

Group Abstract Group Abstract