Message Boards Message Boards

0
|
6321 Views
|
1 Reply
|
0 Total Likes
View groups...
Share
Share this post:
GROUPS:

listcontourplot on a sector of a circle

Posted 9 years ago
s = Import["Desktop/tension.xlsx"];
ListContourPlot[s, Contours -> 10, PlotLegends -> Automatic]

In fact, it is a contour of a circular part from (2,0) (4,0) to (0,4) (0,2). However, I cannot get a contour on a sector of a circle. It has redundant partenter image description here How can I delete that red part to make it a sector of a circle??

Thanks a lot!!!:)

Attachments:
POSTED BY: WANRU LIU

Draw a white disk above the disliked area as follows

In[1]:= s = Import[FileNameJoin[{NotebookDirectory[], "..", "Abt_skrot", "tension.xlsx"}]];
In[8]:= Show[{ListContourPlot[s, Contours -> 10, PlotLegends -> Automatic, DisplayFunction -> Identity], 
              Graphics[{White, Disk[{0, 0}, 2, {0, \[Pi]/2}]}, DisplayFunction -> Identity]}, 
             DisplayFunction -> $DisplayFunction, AspectRatio -> 1]

to see

aWhiteDisk

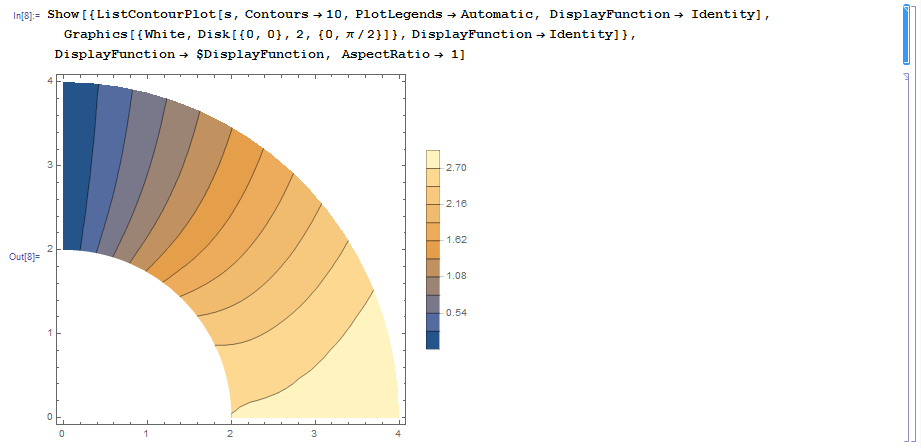
Ask yourself whether this graphics is cheating because the shown inner boundary does not fulfill any boundary condition, right?

POSTED BY: Udo Krause
Reply to this discussion
Community posts can be styled and formatted using the Markdown syntax.
Reply Preview
Attachments
Remove
or Discard

Group Abstract Group Abstract