Message Boards Message Boards

0
|
4407 Views
|
6 Replies
|
0 Total Likes
View groups...
Share
Share this post:
GROUPS:

Can I capture user's selection in Manipulate or Slider?

Posted 9 years ago

After the user finish his selected value, he can then click a Button to put the selected value into a file (I know how to do it). How can I capture the user selected value?

Thanks a lot.

POSTED BY: steve ma
6 Replies
Posted 9 years ago

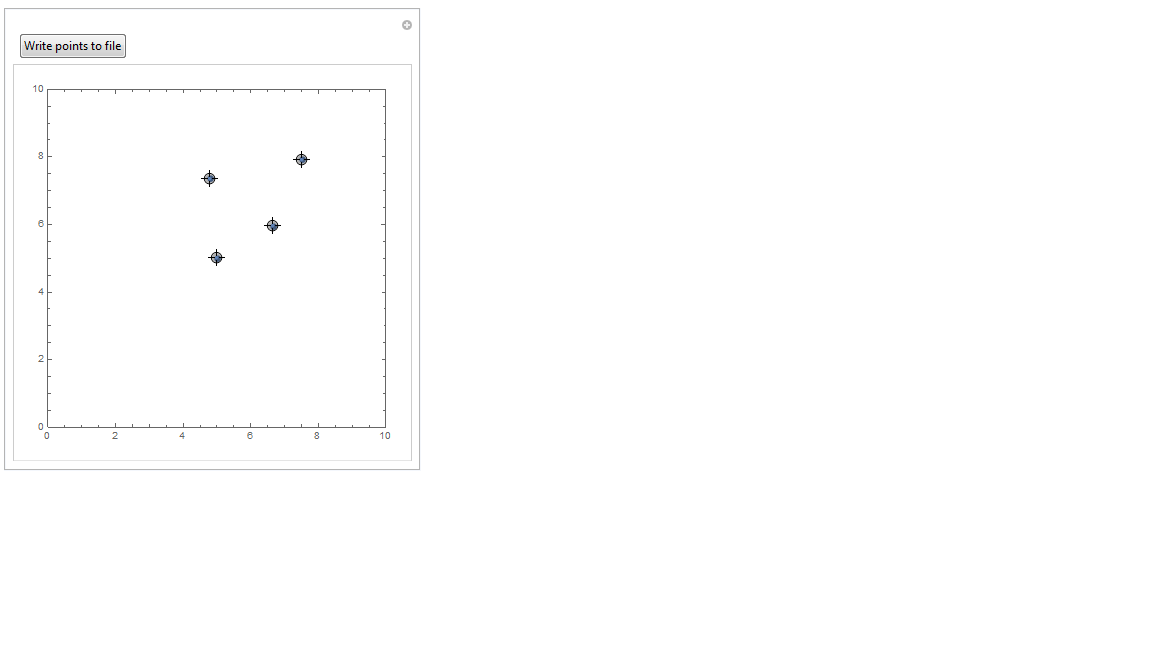
Here are two examples that use the Button function:

Manipulate[
 ListPlot[pts, PlotRange -> {{0, 10}, {0, 10}}, Frame -> True, AspectRatio -> 1],
 {{pts, {{5, 5}}}, Locator, LocatorAutoCreate -> True},
 Button["Write points to file", Export["points.csv", pts]]
 ]

which looks like the following:

Points in Manipulate

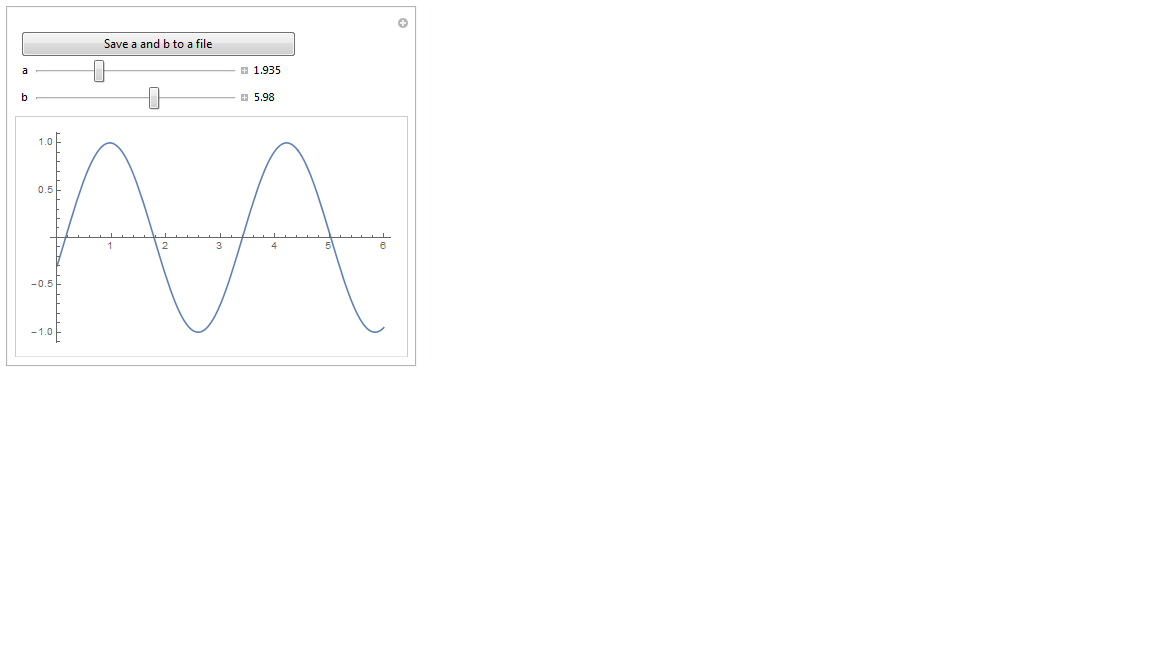
For your recent example slightly modified one might use nearly the same thing:

Manipulate[Plot[Sin[a x + b], {x, 0, 6}],
     Button["Save a and b to a file", Export["ab.csv", {{a, b}}]],
     {a, 1, 4, Appearance -> "Labeled"},
     {b, 0, 10, Appearance -> "Labeled"}
     ]

which looks like

a and b in Manipulate

POSTED BY: Jim Baldwin
Posted 9 years ago

Thank you very much. Very nice.

POSTED BY: steve ma
Posted 9 years ago

But your example does not record the user selected value. After the user click the picture, he could not store the point (x, y) values for further use.

Let's say I have the code Manipulate[Plot[Sin[a x + b], {x, 0, 6}], {a, 1, 4}, {b, 0, 10}]

The user selected a=b=1 by sliding the knobs. The user need to store a=b=1 in a file. How can I write this code to let user do it?

POSTED BY: steve ma
Posted 9 years ago

One can certainly do as you describe. Just save the added points as you go and then when the "Draw" button is pushed "Show" the resulting set of points or connected line segments. However, given what you describe you might want to consider the use of a "Locator" as shown in

Polygon Demonstration

enter image description here

Having the user "click" to generate points that are connected (or not connected) allows just the need to use the mouse rather than the mouse and the keyboard.

POSTED BY: Jim Baldwin
Posted 9 years ago

Thank you for the reply. What I need to do is to plot the user selected value and let him to see it.

Assume the notebook display two sliders x and y from 0 to 10. The user selected x=y=1. Then he clicked the button. Next he selected x=2 and y=3. Then he clicked the button. There is another button named Draw. When he click Draw, he will see two points (1,1) and (2,3) on the notebook.

POSTED BY: steve ma
Posted 9 years ago

Maybe some more specifics are needed to know exactly what you mean by "capture the user selected value". For example, if the user is running your Mathematica code the user's copy of Mathematica, then the file ("he can then click a Button to put the selected value into a file") can be e-mailed to you. If you have access to the server where that file is located, then you could poll the either the existence of the file or determine if the file has been changed since the last time you checked.

Or do you want some "instant" notification that the user has clicked the button? And does the user have access to Mathematica or does the user just have a CDF document? (And that is not to denigrate CDF documents. I love CDF documents.)

Jim

POSTED BY: Jim Baldwin
Reply to this discussion
Community posts can be styled and formatted using the Markdown syntax.
Reply Preview
Attachments
Remove
or Discard

Group Abstract Group Abstract