Matty, thank you very much for actually coming back and posting your finds. Both solutions on your link look so good and useful that I will repost them here.
@b.gatessucks
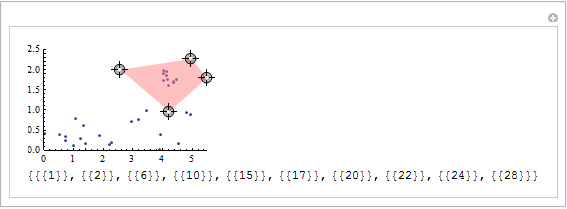
Something like (@Szabolcs provided the link to PointInPoly) :
Manipulate[
  Column[{
    Show[ListPlot[points, PlotRange -> {{0, 5.5}, {0, 2.5}}],
      Graphics[{Pink, Opacity[0.5], Polygon[{p1, p2, p3, p4}]}]],
    Position[points, #] & /@ Select[points, PointInPoly[#, {p1, p2, p3, p4}] == 1 &]}],
  {{p1, {0, 0}}, Locator},
  {{p2, {3, 1}}, Locator},
  {{p3, {1, 1}}, Locator},
  {{p4, {2, 1}}, Locator}]
@Heike
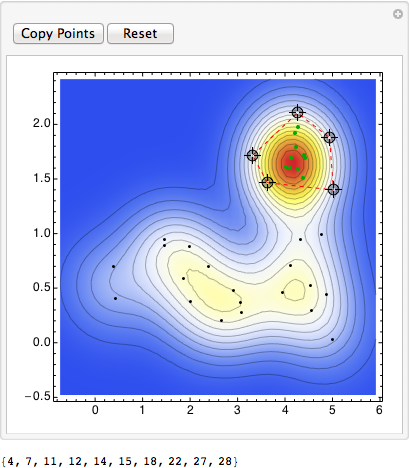
This is basically the same as what b.gatessucks is doing. The main addition is that I've put all the locators in one list. To add vertices to the polygon you just click somewhere on the graph. I've also added a reset button and a button that prints the indices of the points inside the polygon which makes it easier to copy.
points = RandomSample[
   Transpose[{Flatten[{RandomReal[{0, 5}, 20], RandomReal[{4, 4.5}, 10]}],
     Flatten[{RandomReal[1, 20], RandomReal[{1.5, 2}, 10]}]}], 30];

winding[poly_, pt_] := Round[(Total @ Mod[(# - RotateRight[#]) &@
  (ArcTan @@ (pt - #) & /@ poly), 2 Pi, -Pi]/2/Pi)]

DynamicModule[{pl, pos},
 pl = SmoothDensityHistogram[points, ColorFunction -> "TemperatureMap"];
 Manipulate[
  pos = Pick[Range[Length[points]], Unitize[winding[poly, #] & /@ points], 1];
  Show[pl,
   Epilog -> {{Darker[Green], PointSize[Medium], Point[points[[pos]]]},
     {Black, Point[Complement[points, points[[pos]]]]},
     {EdgeForm[{Red, Dashed}], FaceForm[], Polygon[poly]}}],

  {{poly, {}}, Locator, LocatorAutoCreate -> All},
  Row[{Button["Copy Points", Print[pos]], Button["Reset", poly = {}; pos = {}]}]]]