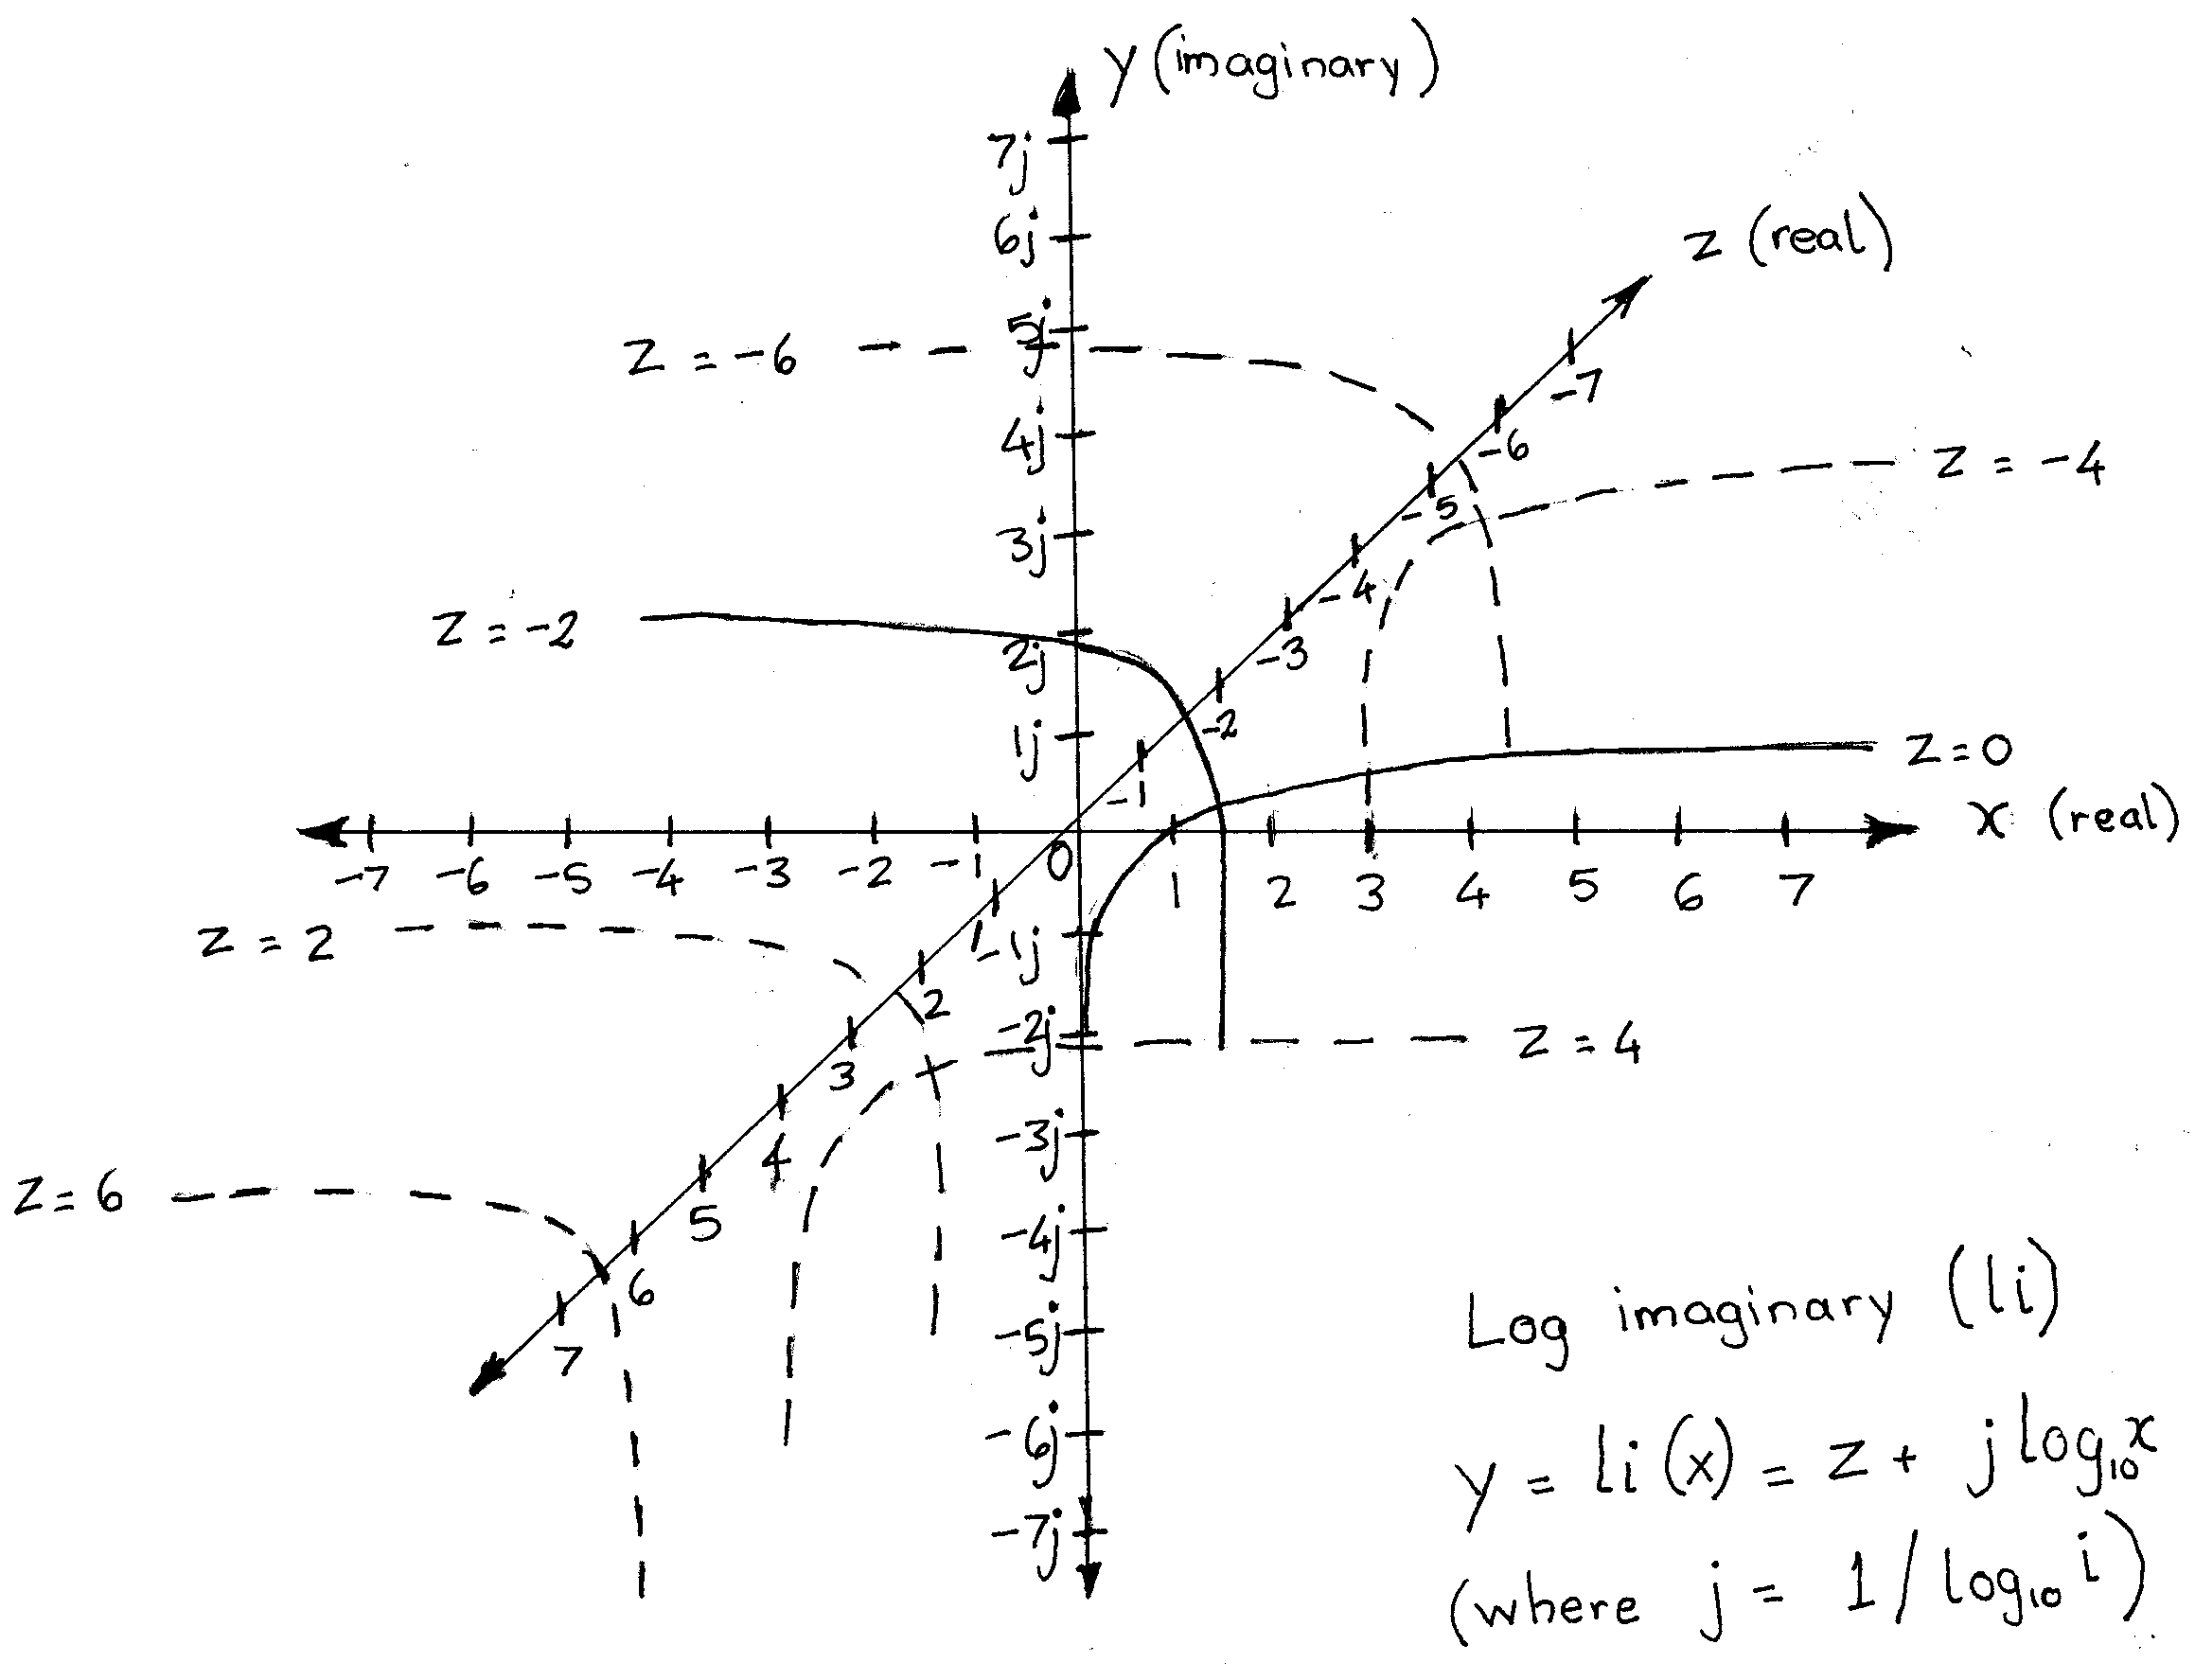
I am trying to plot a family of logarithmic curves. Each curve is in the XY plane as Y=log (X). However there are multiple planes in Z value increments of 4. i.e.: Z=0, Y=Log(X) Z=4, Y=Log(X) Z=8, Y=Log(X) etc.......
Similarly I need the mirror images of these curves plotted with the planes shifted on the Z-axis by 2 i.e. Z=2, Y=Log(-X) Z=6, Y=Log(-X) Z=10, Y=Log(-X) etc..........
I hand drew the curves with the most imporant curves solid and the other curves dotted.
I was trying to find a program that would plot these curves and tried and failed with Desmos. This is the reason I am trying Mathematica. I would greatly appreciate it if anybody could help me or at least point me to a discussion thread which would help me draw this diagram. Thanks, Suresh


