I think this will give you a more useful arrangement of your data.
data1 = Table[{"loc1", i, i^2, i^3}, {i, 1, 10}];
data2 = Table[{"loc2", i, RandomReal[i], RandomReal[i]^3}, {i, 1, 10}];
data = Join[data1, data2];
header = {"Location", "methodname1", "methodname2", "methodname3"};
data = Dataset@Map[AssociationThread[header -> #] &, data];
You can then starting playing with your data. If you want to use Location as a key use GroupBy
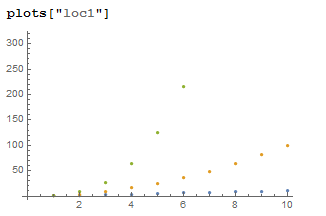
plots = data[GroupBy[#Location &],Query[Transpose, Values@Rest@# &] /* ListPlot];
plots["loc1"]

Alternatively, you may want to fit models to your data. If methodname3 was a response variable then you could do the following:
data2 = Values@Normal@data[Select[#Location == "loc1" &]];
f = LinearModelFit[data2, {x, y^3}, {x, y, z}, NominalVariables -> x];
f["loc1", 6, 36]
With real data you could use both locations to find a model you like and then estimate a location effect.
data3 = Values@Normal@data;
f = LinearModelFit[data3, {x, y, z}, {x, y, z}, NominalVariables -> x]