I wrote code to keep track of the effect of a function f on the individual points of a curve. It assigns a color to a point of the input curve and the same color to that point's image under f. The code works in release 7, but not in later releases. Is there a workaround for later releases? Here's an example of the code:
startTime = SessionTime[]; fineness = 500; repart = 1/2; fullSource = {}; fullTarget = {}; sourcePointSet = {}; targetPointSet = {}; For[n = 0, n < fineness, n++; s[n] = repart + I*n/100; t[n] = N[Zeta[s[n]]]; sourcePointSet = Append[sourcePointSet, s[n]]; targetPointSet = Append[targetPointSet, t[n]]];
reSource = Re[sourcePointSet]; imSource = Im[sourcePointSet]; reTarget = Re[targetPointSet]; imTarget = Im[targetPointSet]; scale = 1; For[n = 0, n < fineness, n++; sourceLP = ListPlot[{{reSource[[n]], imSource[[n]]}}, PlotStyle -> {Hue[n/fineness], PointSize[.002]}]; targetLP = ListPlot[{{reTarget[[n]], imTarget[[n]]}}, PlotStyle -> {Hue[n/fineness], PointSize[.002]}]; fullSource = Append[fullSource, sourceLP]; fullTarget = Append[fullTarget, targetLP]; ];
Print[Show[fullSource, PlotLabel -> "critical line"]]; Print[Show[fullTarget, PlotLabel -> " zeta image"]];
endTime = SessionTime[]; Print["execution time ", endTime - startTime]
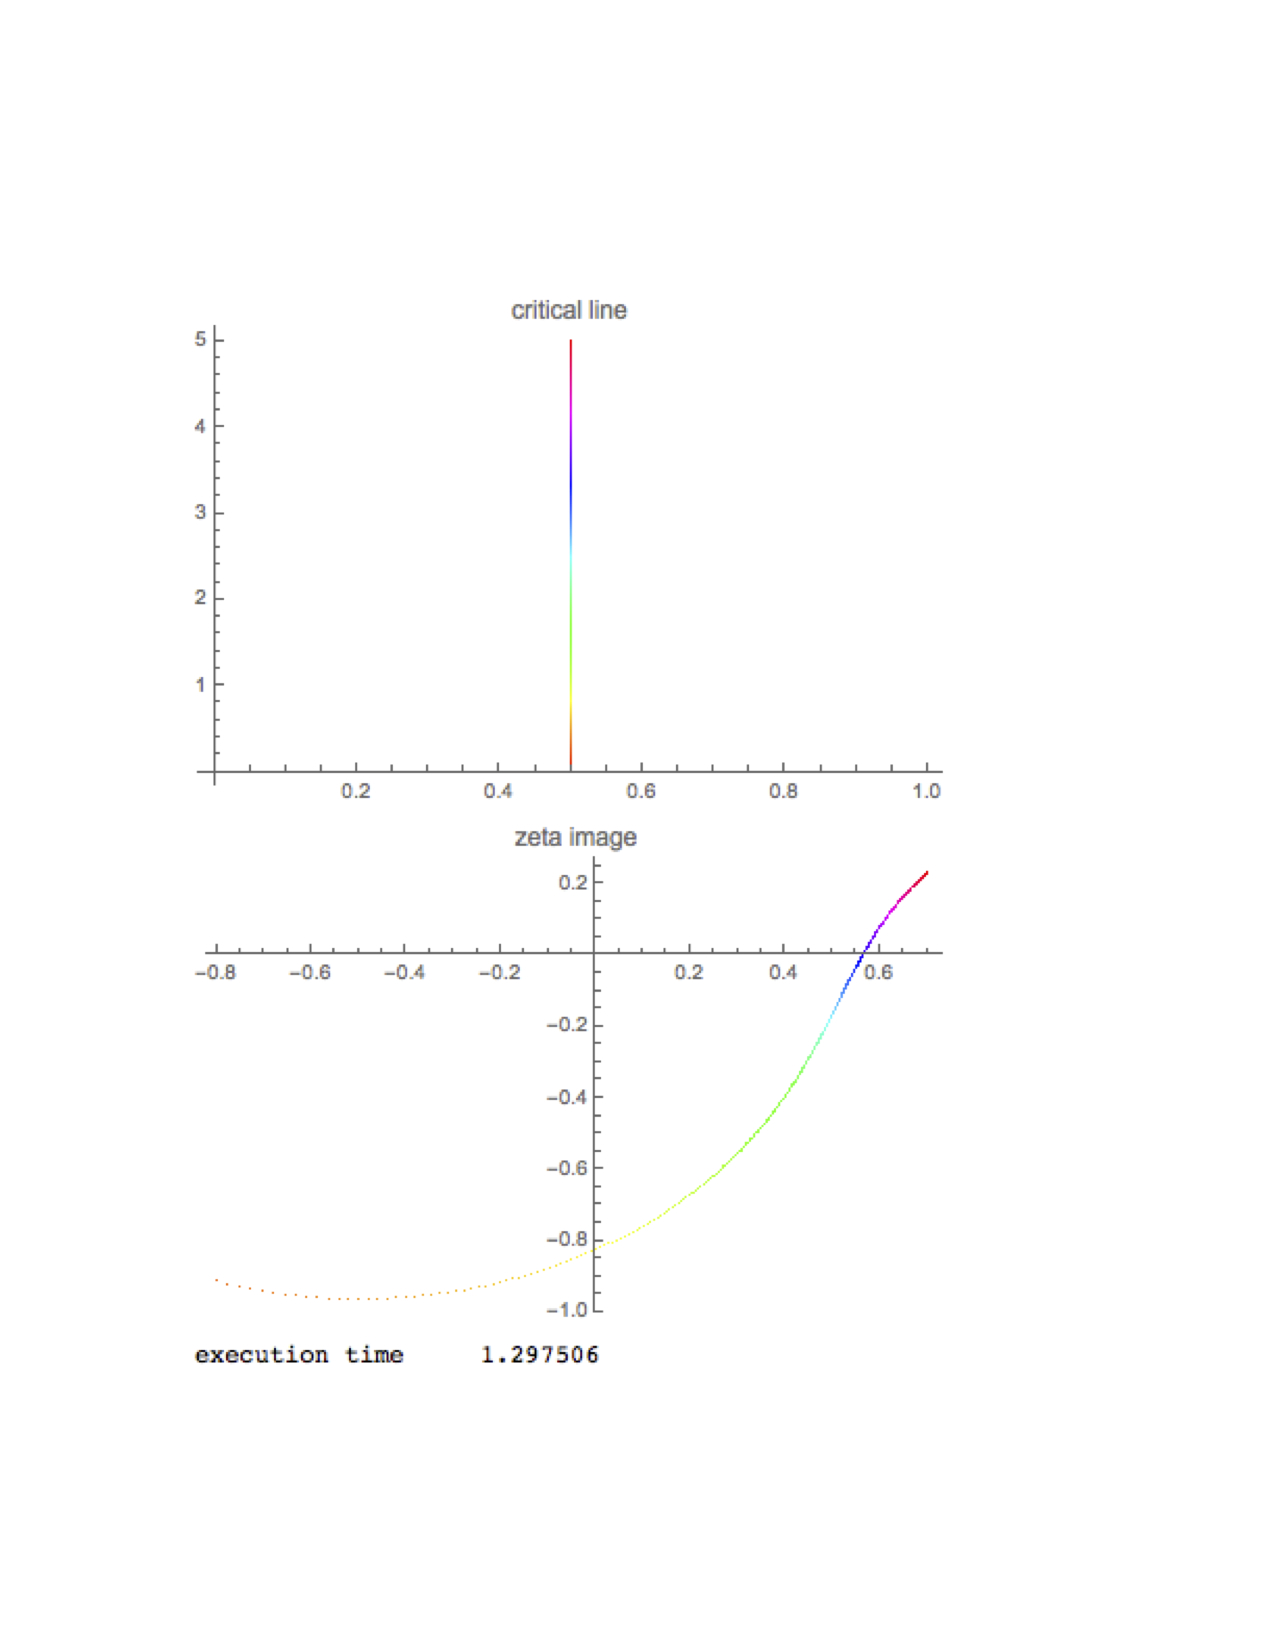
Here's the output in release 7:
 Attachments:


