Message Boards Message Boards

1
|
17685 Views
|
3 Replies
|
5 Total Likes
View groups...
Share
Share this post:

What's the best way to visualize a 3D scalar field?

Posted 9 years ago

I'm trying to find the best way to visualize a 3D scalar field within Mathemaitca. Specifically, if anyone knows how to generate something akin to a "fog" - so a 3D plot that has heavier shading in regions where the scalar is large.

What I'm trying to do is to make an easy way for students in freshmen-level chemistry to visualize the structure of the electron density (a 3D scalar function) around a pair of atoms - i.e. visualizing chemical bonds. I believe that there's great value in helping students understand how bonds between atoms exist in real space, but few incoming students are comfortable reading common visualization tools such as contour plots. I've linked to a simple image of electron density contours in a plane that intersects the nuclei in dinitrogen (N2) and lithium fluoride (LiF), to give you all an idea of what this function looks like:

enter image description here

I've played around with a number of the available 3D plotting functions I've found in the documentation but none of them give me quite what I want. ContourPlot3D seems to get me the closest to what I want. Using that function I'm able to plot a number of 3D contours and using a very low opacity I visualize a few contour shells but this function's drastic range of magnitudes makes it hard to find contours that represent the shape of the charge density both where density is low (so far from the atomic nuclei) or quite large (near the nuclei) - see linked image above. So using ContourPlot3D I'm able to see some of the features that I'm after but I feel a smooth representation would make it easier to see the various topological features of this function.

Any recommendations are greatly appreciated.

3 Replies

Thanks Sean and David, that's exactly what I was looking for!

Posted 9 years ago

Very interesting. Following Sean's suggestion, here are a few ideas in an attached notebook.
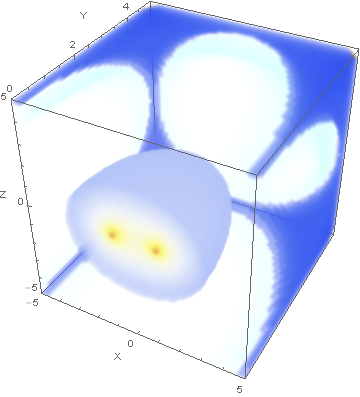
DensityPlot3D[
 Log10[density[x, y, z]], {x, y, z} \[Element] 
  ImplicitRegion[-rx <= x <= rx && -rx <= z <= rx && 0 <= y <= rx, {x,
     y, z}], AxesLabel -> {"X", "Y", "Z"}, 
 ColorFunction -> "TemperatureMap"]

enter image description here

Attachments:
POSTED BY: David Keith

It sounds like you're describing DensityPlot3D:

http://reference.wolfram.com/language/ref/DensityPlot3D.html

POSTED BY: Sean Clarke
Reply to this discussion
Community posts can be styled and formatted using the Markdown syntax.
Reply Preview
Attachments
Remove
or Discard

Group Abstract Group Abstract