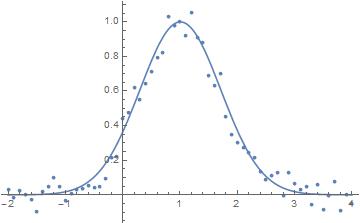
Look at the help page and carefully compare the form of your data with that or with this
In[1]:= data = Table[{x, E^-(x - 1)^2 + RandomReal[{-.1, .1}]}, {x, -2., 4., 1/10}]

Out[1]= {{-2., 0.0301034}, {-1.9, -0.0154798}, {-1.8, 0.022465}, {-1.7, 0.0010194}, {-1.6, -0.0295686},
 {-1.5, -0.0952078}, {-1.4, 0.0208647}, {-1.3, 0.0503616}, {-1.2, 0.100381}, {-1.1, 0.0454354},
 {-1., -0.0307495}, {-0.9, 0.00838033}, {-0.8, 0.0325882}, {-0.7, 0.0383335}, {-0.6, 0.0515882},
 {-0.5, 0.0404762}, {-0.4, 0.0451534}, {-0.3, 0.0915646}, {-0.2, 0.217585}, {-0.1, 0.222667},
 {0., 0.440198}, {0.1, 0.477472}, {0.2, 0.618511}, {0.3, 0.550046}, {0.4, 0.640443}, {0.5, 0.712902},
 {0.6, 0.791899}, {0.7, 0.824463}, {0.8, 1.02962}, {0.9, 0.979843}, {1., 0.999929}, {1.1, 0.920938},
 {1.2, 1.05641}, {1.3, 0.908881}, {1.4, 0.881643}, {1.5, 0.689059}, {1.6, 0.632981}, {1.7, 0.700848},
 {1.8, 0.452774}, {1.9, 0.346829}, {2., 0.299357}, {2.1, 0.275064}, {2.2, 0.245725}, {2.3, 0.212584},
 {2.4, 0.136231}, {2.5, 0.0869989}, {2.6, 0.109057}, {2.7, 0.128253}, {2.8, -0.00609724}, {2.9, 0.126926},
 {3., 0.0669788}, {3.1, 0.0309545}, {3.2, 0.0471385}, {3.3, -0.0577374}, {3.4, 0.0613904}, {3.5, -0.0870592},
 {3.6, -0.0039362}, {3.7, 0.0774653}, {3.8, -0.0933359}, {3.9, 0.00204892}, {4., -0.0526784}}

In[2]:= fun = Normal[NonlinearModelFit[data, E^-(x - a)^2, a, x]];
g = Show[ListPlot[data], Plot[fun, {x, -2, 4}]]
