Ok, so I have 25 rods. Each rod with different lengths defined in a table
chordlength={295.21, 295.21, 294.755, 293.27, 291.085, 288.395, 284.575, 279.89,
    275.225, 269.995, 263.84, 256.695, 247.85, 238.06, 228.83, 219.175,
    208.08, 196.945, 184.89, 170.95, 155.815, 138.73, 118.755, 97.805,
    78.055}
And than I apply some ARBITRARY force density to them. Here is my code for quadratic and constant force density:
DensityTop =
       Table[With[{j = j}, ((# - 0.6*chordlength[[j]]/10^2)^2 + .2) &], {j,
          1,25, 1}];
     DensityBtm =
       Table[With[{j = j},1 &], {j,
        1, 25, 1}];
Now my idea (to be more accurate: what I really wanted and need to do) was that if I would plot the data, all the plots would look exactly the same as the first one except the scale on the x axis should change.
BUT if I actually plot them:
Table[Plot[{DensityTop[[j]][x], DensityBtm[[j]][x]}, {x, 0,
   chordlength[[j]]/10^2}, Filling -> Axis,
  PlotStyle -> {Gray, Orange},
  FrameLabel -> {StandardForm["Profile length [m]"],
    StandardForm["Force density [N/m]"]},
  PlotLegends -> {StandardForm["Top"], StandardForm["Bottom"]},
  ImageSize -> 600, PlotLabel -> StandardForm[N[j]"Cell"],
  Frame -> True, PlotRange -> All], {j, 1, 25,
  1}]
You can see that the plots are far away from being the same!! DensityTop[[1]] is not the same as DensityTop[[25]].
To further explain the problem: Lets say the force density looks something like this (the programming has to work for an arbitrary force density). 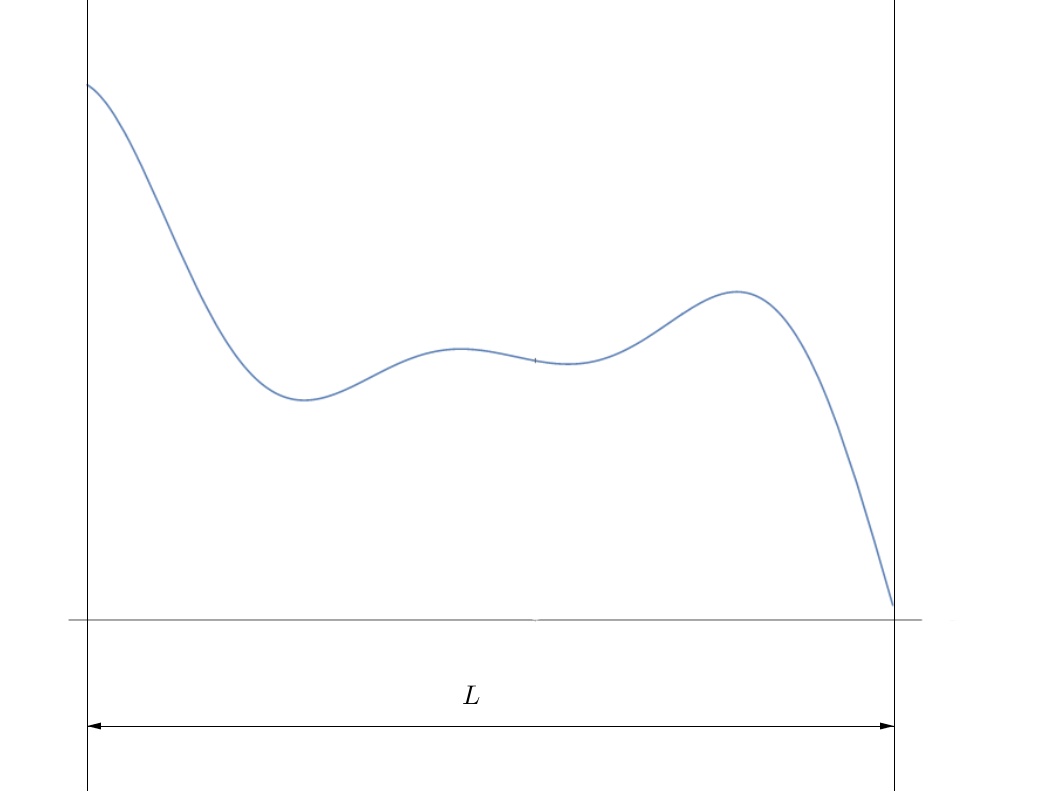
I deliberately deleted the ticks on both axes because they are not important. The only two things important are:
- the shape of the force density function, which has to be the same for all rods! (Not important information: on the attached picture, the function is $Sinc[x]*(x^3 + (x - 1)^2 + x) + 25$ and I made it up.)
- length of the rod.
In case the problem is not clear, here is another example. Lets say my force density is a sum of Heaviside functions $$f(x)=?[?(x?\frac{2}{10}L)??(x?\frac{4}{10}L)]+?[?(x?\frac{6}{10}L)??(x?\frac{8}{10}L)]$$ where first step begins at 20% of the total rod length $L$ and ends at 40%, and the second step is from 60-80%. This would look something similar to this: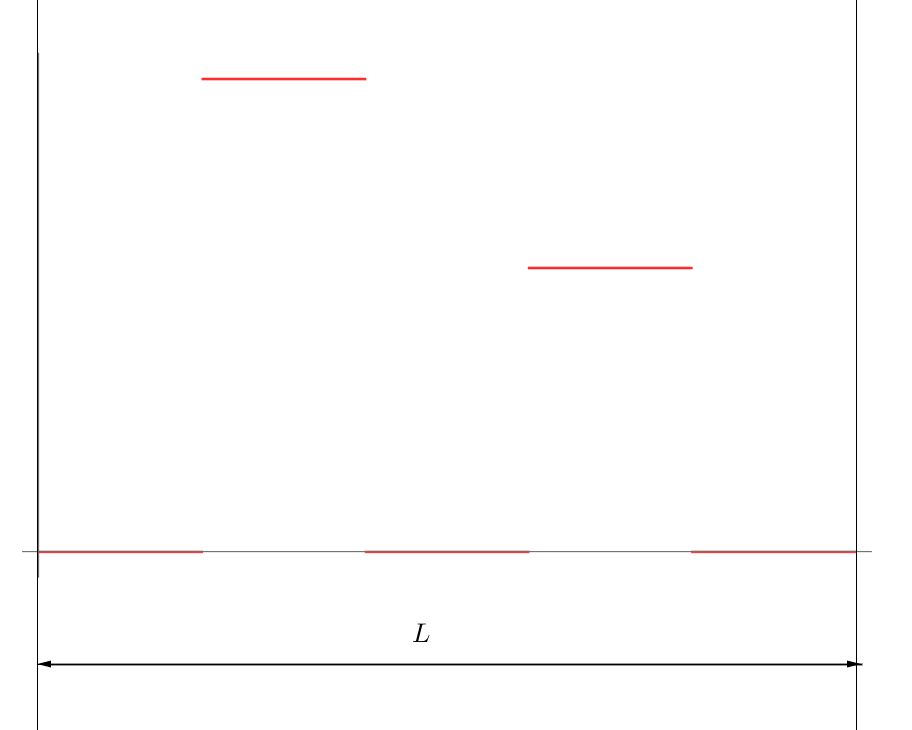
And this is the force density I want to apply to each rod. And this is also the case that works exactly as I want it to. All rods will experience absolutely NO force from 0-20%, than $?$ force from 20-40%, than again nothing from 40-60% and $?$ force from 60-80% and finally again nothing from 80-100%.
It's rather simple to do it with Heaviside functions but my needs go beyond unrealistic case of Heaviside functions. A quadratic force density is more realistic or maybe something even more complicated. But each rod has to have the same force density applied, meaning:
- if the fist rod has minimum force at 60%, all others have the same.
- if force density reaches maximum at 30% it has to at all rods. And The difference between minimum and maximum has to be the same for all rods.
- If $$\frac{f(x=0)}{f(x=L)}=0.02$$ for the first rod, than this has to apply for all other 24 rods.
Now I think I can't explain in more details than I just did. Hopefully that is good enough.
So my questions is: How do I change my DensityTop functions so that the force Density applied to rods will look the same for all? I tried to use Resize like this:
DensityTop =
  Table[With[{j =
      j}, (((chordlength[[1]]/10^2)*
           Rescale[#, {0, chordlength[[j]]/10^2}] -
          0.6*chordlength[[j]]/10^2)^2 + .2) &], {j, 1, 25, 1}];
But this doesn't do the job. :((


