UPDATED
Hi!
The following code gives me a 3D graph that consists of several planes.
points = {{0, 0, 0}, {2, 3, 6}, {3, 1, 5}, {4, 5, 15}, {5, 2, 10}}

Needs["TetGenLink`"]

{pts, surface} = TetGenConvexHull[points];
Graphics3D[GraphicsComplex[pts, Polygon[surface]]];

normal[xyz_, vertList_] :=
  Block[{u, v}, u = xyz[[vertList[[2]]]] - xyz[[vertList[[1]]]];
   v = xyz[[vertList[[3]]]] - xyz[[vertList[[2]]]];
   Cross[u, v]];


bottomTriangles = Select[surface, (normal[pts, #].{0, 0, 1} > 0) &];

CPS = Graphics3D[GraphicsComplex[pts, Polygon[bottomTriangles]],
  Axes -> True, BoxRatios -> {1, 1, 2/3}, AxesLabel -> {q1, q2, C}]
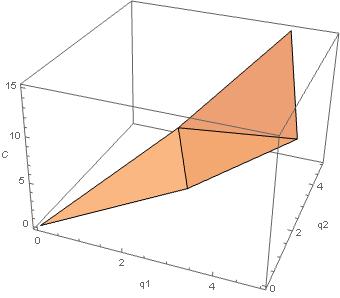
The three axes are (q1,q2,C). I would like to make a 2d gradient plot (q1,q2), i.e. like looking down at the 3d graph from the top, such that the arrows show the gradients at different points. In this case each plane will have the same gradient everywhere, but different planes will have different gradients. How can I make such a plot in Mathematica?
Thank you very much for your time and consideration.
Best, Alex


