Message Boards Message Boards

0
|
13887 Views
|
2 Replies
|
0 Total Likes
View groups...
Share
Share this post:

Finding peaks in Excel data series

Posted 9 years ago

In Excel 2010 32-bit, suppose I have a data series identified by X (row 1) and Y (row 2):

enter image description here

The goal is to identify the peaks (highlighted in yellow) in row 3:

enter image description here

Inside a Mathematica notebook, the solution is in (https://reference.wolfram.com/language/ref/FindPeaks.html)

enter image description here

Inside Excel using ExcelLink 3.5, what code can I use so that the peaks are marked by "Yes" in row 3? Any help will be much appreciated!

Attachments:
POSTED BY: nat dlsantos
2 Replies
Posted 9 years ago

Imports the excel file, finds

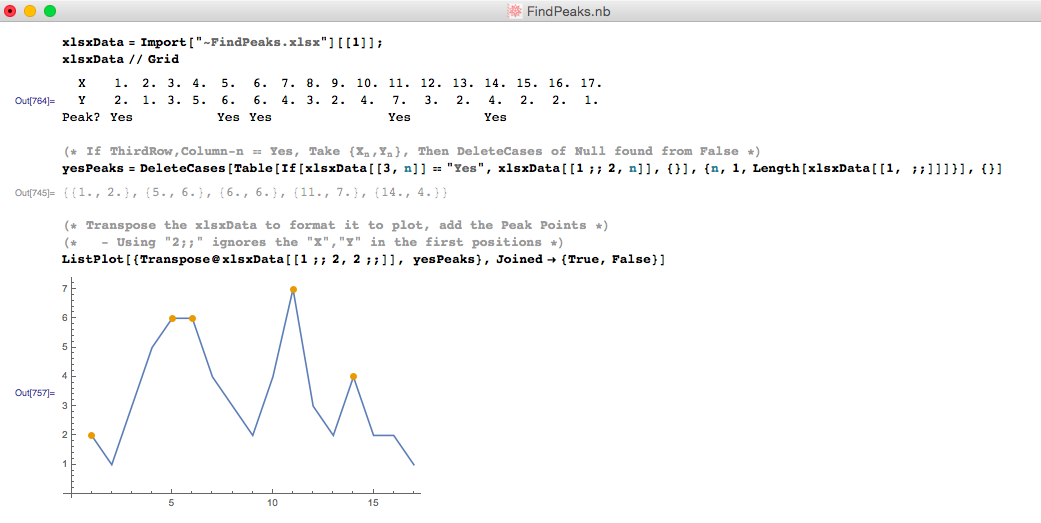
xlsxData = Import["~FindPeaks.xlsx"][[1]];

yesPeaks = DeleteCases[ Table[If[xlsxData[[3, n]] == "Yes", xlsxData[[1 ;; 2, n]], {}], {n, 1, Length[xlsxData[[1, ;;]]]}], {}]

ListPlot[{Transpose@xlsxData[[1 ;; 2, 2 ;;]], yesPeaks}, Joined -> {True, False}]

POSTED BY: Matt B.
yesPeaks = 
 DeleteCases[
  Table[If[xlsxData[[3, n]] == "Yes", xlsxData[[1 ;; 2, n]], {}], {n, 
    1, Length[xlsxData[[1, ;;]]]}], {}]

ListPlot[{Transpose@xlsxData[[1 ;; 2, 2 ;;]], yesPeaks}, 
 Joined -> {True, False}
 , Epilog -> {Red, PointSize[0.04], Point[yesPeaks]}
 ]

PlotPoints

POSTED BY: Jos Klaps
Reply to this discussion
Community posts can be styled and formatted using the Markdown syntax.
Reply Preview
Attachments
Remove
or Discard

Group Abstract Group Abstract