The following is a rather extended solution using two packages I'm involved with. The GrassmannCalculus package, which I am developing with John Browne. It is rather extensive and you can get information about it here:
GrassmannCalculus
The Presentations package, which I sell, has I think a more convenient graphics paradigm dealing directly in terms of graphics primitives. In any case, you could stay with the Mathematica Grad function and the Show statement for combining graphics.
<< GrassmannCalculus`
<< Presentations`
We set a 2-dimensional vector space using orthonormal basis vectors.
SetEuclideanNSpace[2, {x, y}, "Orthonormal"]
Here is your function:
f[x_, y_] := x^2 + x y + y^2
The gradient can be calculated very simply with Mathematica.
Grad[f[x, y], {x, y}]
giving
{2 x + y, x + 2 y}
It can also be calculated in GrassmannCalculus, in which case we obtain a vector expression in terms of the orthonormal vectors. In Grassmann algebra the vectors are always maintained and are not only part of the notation but also elements of the algebra.
step1 = GrassmannGrad[f[x, y]]
giving

The following expression converts it to the component list as with Mathematica.
step1 // ToListCoordinates
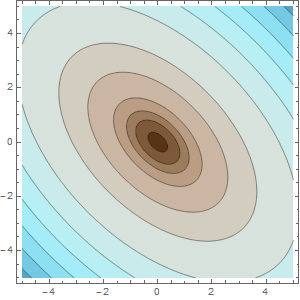
We draw the contour plot. ContourDraw is basically like ContourPlot but extracts the primitives. Except here I'm using an extra feature of Presentations called ContourColors. It adjusts the colors between contours so that each region has a distinct color or shading even if some contours are close together in value and others far apart.
functionDraw =
  Module[{contourList},
   contourList = Union[{0, 0.1, 0.5, 1, 2, 5}, Range[10, 80, 10]];
   ContourDraw[f[x, y], {x, -5, 5}, {y, -5, 5},
    Contours -> contourList,
    ColorFunctionScaling -> False,
    ColorFunction ->
     ContourColors[contourList, ColorData["BrownCyanTones"]]]
   ];
This plots the function. In the notebook the contour values will be labeled with tooltips.
Draw2D[
 {functionDraw},
 Frame -> True,
 ImageSize -> 300]
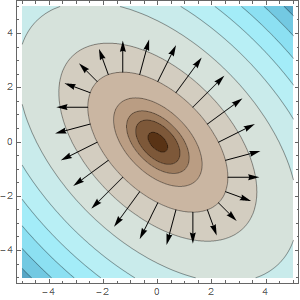
Now the question is how to draw the gradient vectors? Often we might fill the entire plot with vectors, but this often gets cluttered. I like to minimize the number of vectors. Sometimes it's useful to just have a single vector attached to a Locator that you can drag around the plot and explore the gradient. I'm going to put a single set of gradient vectors around one of the contours. This won't clutter the plot too much and the pattern is similar for all contours.
For this we need to find a parametrization for the ellipse. This involved most of the work. The standard ellipse is parametrized by:
ellipse1[a_, b_][t_] := {a Cos[t], b Sin[t]}
You can check that this parametrizes:
p^2/a^2 + q^2/b^2 == 1;
It's clear that the contour ellipses are rotated by 45 degrees. We'll need a rotation matrix and rules for transitioning between x,y and p,q coordinates.
rotationMatrix[t_] = {{Cos[t], -Sin[t]}, {Sin[t], Cos[t]}};
pqRotationRules[t_] = Thread[{p, q} -> rotationMatrix[t].{x, y}];
xyRotationRules[t_] = Thread[{x, y} -> rotationMatrix[t].{p, q}];
We start with your equation for contour value 5. Rotating it gives the equation in standard form.
x^2 + x y + y^2 == 5
% /. xyRotationRules[\[Pi]/4] // ExpandAll //
  Collect[#, {x^2, y^2, x y}, Together] &;
Distribute[#/5] & /@ %
giving
x^2 + x y + y^2 == 5
(3 p^2)/10 + q^2/10 == 1
Setting a^2==10/3 and b^2==10, we can write a parametrization for the contour with value 5.
ellipse2[t_] =
 ellipse1[Sqrt[10/3], Sqrt[10]][t].rotationMatrix[-\[Pi]/4]
giving
{Sqrt[5/3] Cos[t] - Sqrt[5] Sin[t], Sqrt[5/3] Cos[t] + Sqrt[5] Sin[t]}
Now we need a routine to draw a vector as a function of the angle t.
gradientVectorDraw[t_] :=
 Module[{x, y, grad},
  {x, y} = ellipse2[t];
  grad = {2 x + y, x + 2 y};
  {Arrowheads[0.04], Arrow[{{x, y}, {x, y} + 0.3 grad}]}
  ]
And we can draw the function with a set of gradient vectors.
Draw2D[
 {functionDraw,
  Table[gradientVectorDraw[t], {t, 0, 2 \[Pi] - \[Pi]/12, \[Pi]/12}]},
 Frame -> True,
 ImageSize -> 300]