I believe that the Mathematica graphics paradigm could be much improved. I see as a problem that it has become more and more filled with special types of unrelated plots. In an effort to add flexibility to these plots I feel they have been encumbered with many techniques and options to try to accommodate various usages. But it is difficult to anticipate every possible usage and thus users often become frozen into forms that don't quite satisfy their requirements with no easy way out. There may be a wall, but more often it's more of a stream, ravine or barbed wire. This has an overall dampening effect on GRAPHICAL creativity and innovation. Elsewhere, Mathematica's overall effect on innovation is quite the opposite!
One example of this kind of problem was a posting on Space between histogram bins. There didn't seem to be a really satisfactory answer to this simple problem. A number of different plot types were proposed: Histogram, RectanglePlot, BarChart. It was suggested to change the bar widths by putting a thick white edge on them, but this would also change the height. I'll suggest a solution below.
I would like to suggest as a paradigm for Mathematica graphics: Everything is graphical Directives and Primitives; and the principal operation is drawing on a sheet of paper. This is easy to understand and, if we have a sufficient set of directives and primitives, easy to do. A user or WRI might then create composite primitives by assembling basic primitives. But they would still be primitives. And one could still draw with them.
The trouble is that WRI favored the plot as the basic graphical item and primitives were secondary. Plots and primitives are on different levels so they are awkward to combine. Initially it wasn't that difficult to extract the primitives and manipulate them if one wanted. But over time the underlying primitives became more convoluted and at times inaccessible as primitives. Sometimes the plot performs calculations that produce some underlying algebraic structure from which a graphic is produced. It would be nicer if this algebraic structure could be obtained directly by the user and then he could produce his own graphic.
It is certainly useful to have high level set-piece common plot types. Nevertheless it's difficult for WRI to anticipate every useful graphical innovation so it would be better if these plot types were built out of the basic set of primitives and a user, if necessary, could repair to the primitive level for design of graphical displays. This would also take a burden off WRI to have to anticipate every possible plot type and variation.
Here is a possible solution to the problem of specifying spacing between bars in a histogram plot. Abandon the Histogram plot and define a BasicBar primitive that can be manipulated to build the plot.
BasicBar::usage =
  "BasicBar[faceFormData, edgeFormData, textureData] will draw a unit \
edge square with the lower center at the origin and with the \
specified styles.";
SyntaxInformation[BasicBar] = {"ArgumentsPattern" -> {_., _., _.}};
BasicBar[faceFormData_: Automatic, edgeFormData_: Automatic,
  textureData_: None] :=
 {Switch[faceFormData,
   Automatic, FaceForm[Directive[GrayLevel[0.5]]],
   None, Unevaluated[Sequence[]],
   _, FaceForm[faceFormData]],

  Switch[edgeFormData,
   Automatic, EdgeForm[Directive[Black]],
   None, Unevaluated[Sequence[]],
   _, EdgeForm[edgeFormData]],

  Switch[textureData,
   None, Unevaluated[Sequence[]],
   _, Texture[textureData]],

  Polygon[{{-.5, 0}, {.5, 0}, {.5, 1}, {-.5, 1}},
   VertexTextureCoordinates -> {{0}, {0}, {1}, {1}}]}
I do use some routines from my Presentations Application in the following.
`<< Presentations
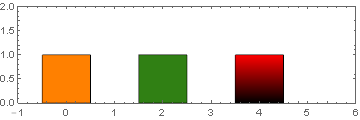
Here TranslateOp is just a postfix form of Translate. (Why doesn't WRI provide this in the convenient postfix form?) So here are three examples.
textureData = Table[{c, 0, 0}, {c, 0, 1, 1/100}];
Draw2D[
 {BasicBar[Orange],
  BasicBar[ColorData["Legacy"]["SapGreen"]] // TranslateOp[{2, 0}],
  BasicBar[None, Black, textureData] // TranslateOp[{4, 0}]},
 PlotRange -> {{-1, 6}, {0, 2}},
 Frame -> True
 ]
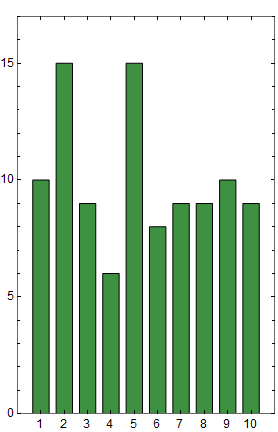
Here is some data for a histogram plot.
histogramData = Tally[RandomInteger[{1, 10}, 100]] // Sort
{{1, 10}, {2, 15}, {3, 9}, {4, 6}, {5, 15}, {6, 8}, {7, 9}, {8,  9}, {9, 10}, {10, 9}}
Now the user can specify a routine to draw the bars for each of the bins. We specify the basic bar, then scale it to the proper height and narrow the width to obtain space between the bars. Then translate it to the proper place on the axis.
bin[i_] :=
 Module[{center, height, bar},
  {center, height} = histogramData[[i]];
  bar = BasicBar[ColorData["Legacy"]["CobaltGreen"], Black];
  bar // ScaleOp[{0.7, height}, {0, 0}] // TranslateOp[{center, 0}]
  ]
Then plot it using the bin function. This also uses a CustomTicks function that gives easier control over ticks, for example also drawing the minor ticks.
xticks = CustomTicks[Identity, {1, 10, 1, 1},
   CTNumberFunction -> (Style[#, Black, 12] &)];
yticks = CustomTicks[Identity, {0, 20, 5, 5},
   CTNumberFunction -> (Style[#, Black, 12] &)];
Draw2D[
 {Table[bin[i], {i, Length[histogramData]}]},
 PlotRange -> {{0, 11}, {0, 17}},
 Frame -> True,
 FrameTicks -> {xticks, yticks, xticks // NoTickLabels,
   yticks // NoTickLabels}
 ]
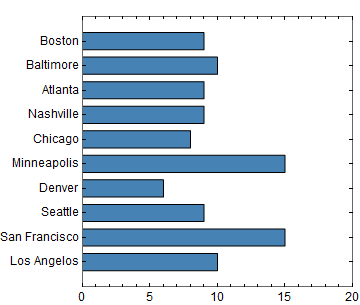
If we wanted horizontal bars and longer tick labels we could use:
bin2[i_] :=
 Module[{center, height, bar},
  {center, height} = histogramData[[i]];
  bar = BasicBar[ColorData["Legacy"]["SteelBlue"], Black];
  bar // ScaleOp[{0.7, height}, {0, 0}] //
    RotateOp[-\[Pi]/2, {0, 0}] // TranslateOp[{0, center}]
  ]
labels = {"Los Angelos", "San Francisco", "Seattle", "Denver",
   "Minneapolis", "Chicago", "Nashville", "Atlanta", "Baltimore",
   "Boston"};
And plot:
yticks = CustomTicks[Identity, {1, 10, 1, 1},
   CTNumberFunction -> (Style[labels[[#]], Black, 12] &)];
xticks = CustomTicks[Identity, {0, 20, 5, 5},
   CTNumberFunction -> (Style[#, Black, 12] &)];
Draw2D[
 {Table[bin2[i], {i, Length[histogramData]}]},
 AspectRatio -> 1,
 PlotRange -> {{0, 20}, {0, 11}},
 Frame -> True,
 FrameTicks -> {xticks, yticks, xticks // NoTickLabels,
   yticks // NoTickLabels}
 ]
Or with the labels on the bars and tooltips.
bin3[i_] :=
 Module[{center, height, bar},
  {center, height} = histogramData[[i]];
  bar = BasicBar[GrayLevel[0.9], Black];
  bar = {bar // ScaleOp[{0.7, height}, {0, 0}] //
     RotateOp[-\[Pi]/2, {0, 0}],
    Text[Style[labels[[i]], Bold, 12,
      FontFamily -> "Hevetica"], {height/2, 0}]};
  Tooltip[bar // TranslateOp[{0, center}], height]
  ]

xticks = CustomTicks[Identity, {0, 20, 5, 5},
   CTNumberFunction -> (Style[#, Black, 12] &)];
Draw2D[
 {Table[bin3[i], {i, Length[histogramData]}]},
 AspectRatio -> 1,
 PlotRange -> {{0, 20}, {0, 11}},
 Frame -> True,
 FrameTicks -> {xticks, None, xticks // NoTickLabels, None}
 ]
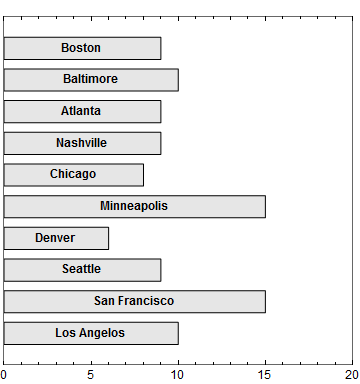
There is a great deal of intuitive flexibility when one can work directly with primitives, rather than through options, which are either more limited or often difficult to specify.


