This can likely be improved, but:
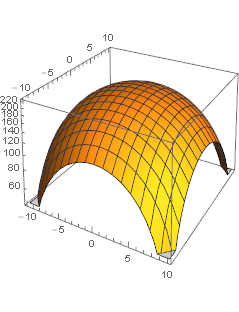
data = Flatten[
   Table[{x, y, 220 - x^2 - y^2}, {x, -10, 10}, {y, -10, 10}], 1];

listLogPlot3D[data_, opts___] := Module[{logData, zDivisions, zTicks},
  logData =
   Select[data, #[[3]] > 0 &] /. {x_, y_, z_} -> {x, y, Log10[z]};
  zDivisions =
   Select[FindDivisions[MinMax[data[[All, 3]]], 10], # > 0 &];
  zTicks = {Log10[#], #} & /@ zDivisions;
  ListPlot3D[logData, Ticks -> {Automatic, Automatic, zTicks}, opts]
  ]

listLogPlot3D[data, AspectRatio -> 1]
(Sorry, Sander. We were both working at the same time. ;-) )


