The following bug is introduced in 9.0 and persisting through 10.3.
For test purposes I have used the following code:
plot = ListPlot[{{0.25, 0.25}, {0.5, 0.5}, {0.75, 0.75}},
   Frame -> True, PlotRange -> {{0, 1}, {0, 1}}, Joined -> True,
   AspectRatio -> 1,
   FrameLabel -> {{"y (mm)", ""}, {"x (mm)",
      "aaaaaaaaaabbbbbbbbbbccc"}},
   BaseStyle -> {FontWeight -> "Bold", FontSize -> 40,
     FontFamily -> "Calibri"}, ImageSize -> 800];

Export["F:\\export23.png", plot, "png"];
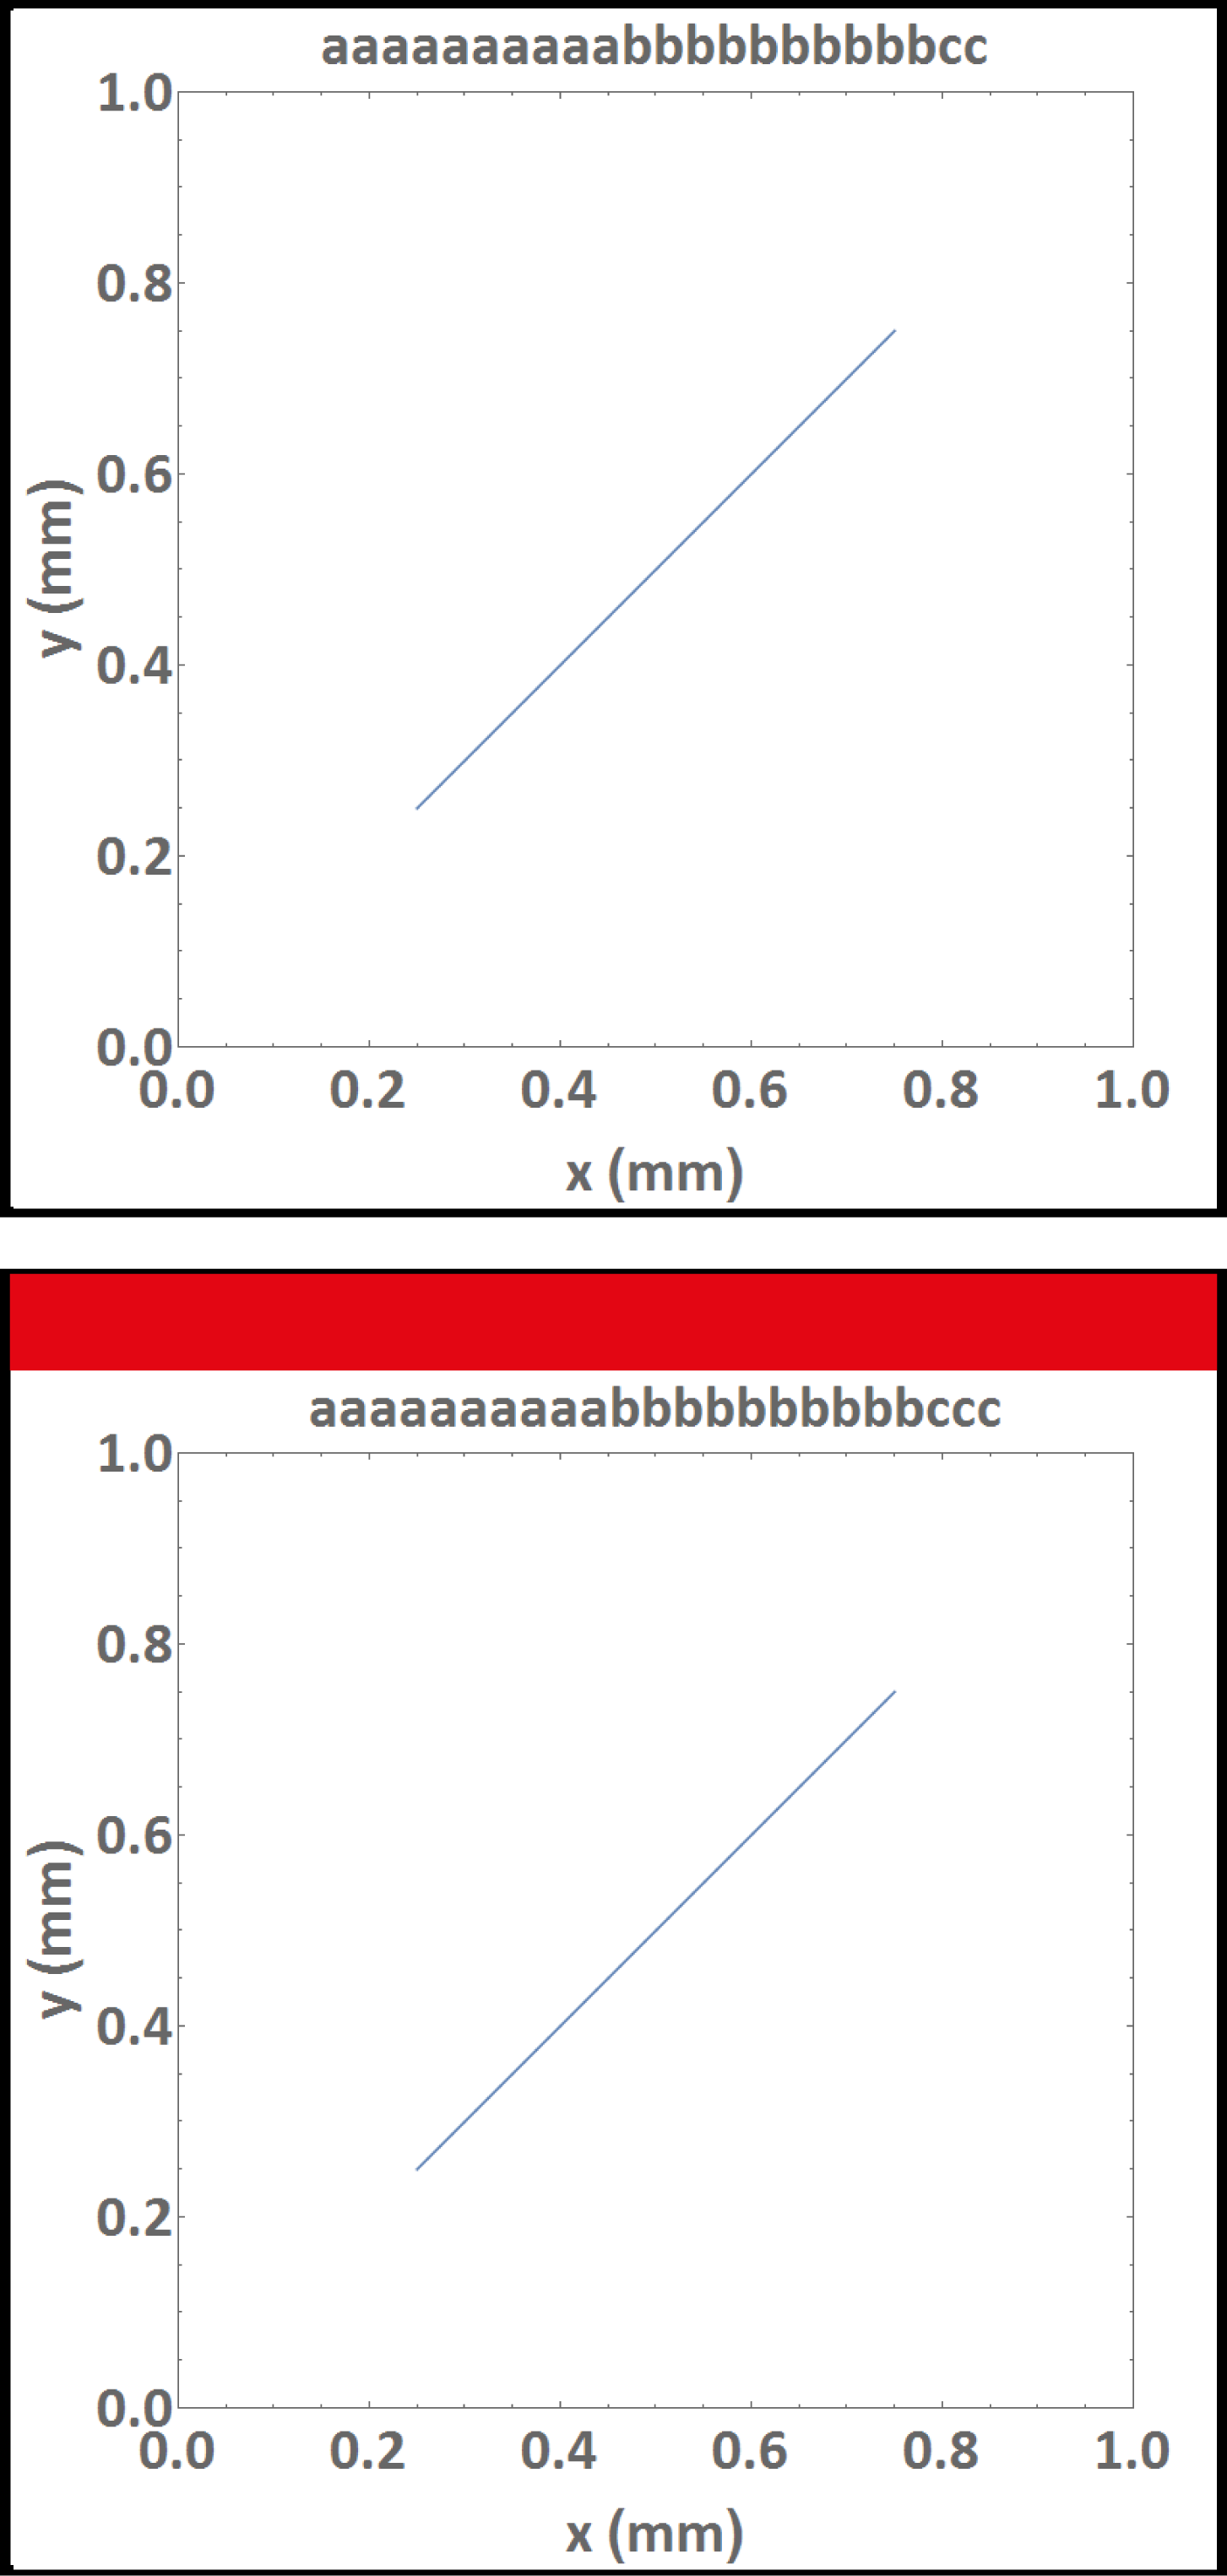
The upper plot margin depends on the length of the 4th string of FrameLabel.
Here are two images for comparison with a string length of 22 and 23 characters. The red square area marks the additional margin which occurs for 23 character length and more.
This problem does not! occur when the images are saved directly from the notebook via "Save Graphic As ..."
Comments from stackexchange.com
Comment from http://mathematica.stackexchange.com/users/280/alexey-popkov: "Reproduced with versions 10.0.1, 10.2 and 10.3 on Win7 x64. With version 8.0.4 both plots have no extra space, with version 9.0.1 both have extra space, with versions 10.x the first plot has no extra space but the second has. So I think the bug is introduced in version 9."
A solution to this bug is given by http://mathematica.stackexchange.com/users/7009/hubble07: "Including ImagePadding seems to work. Try adding ImagePadding -> {{All, All}, {All, 50}} "


