Group Abstract Group Abstract

Message Boards Message Boards

1
|
9.1K Views
|
7 Replies
|
4 Total Likes
View groups...
Share
Share this post:

BubbleChart Diameter does Not Support Dynamic Update? Bug?

Posted 10 years ago

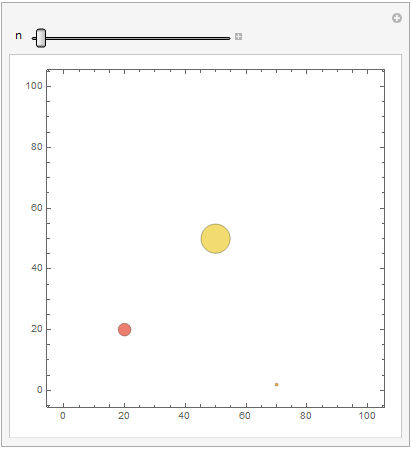
BubbleChart seems does not support dynamic update, like Manipulate.

See example below, the center bubble {50,50,50}, the data is fixed. It should not change its diameter, but it is changing. I tried both area and diameter option. Maybe bubble diameter is control by an internal programm, it affected by the distance of all bubbles layout? In my opinion, the bubble diameter input data should have a higher priority than layout optimization?

data = Table[{{20, 20, 20/d}, {70, 2 d, 2 d }, {50, 50, 50}}, {d, 20}];

Manipulate[
 BubbleChart[data[[n]], ChartStyle -> 24, BubbleSizes -> Automatic, 
  PlotRange -> {{0, 100}, {0, 100}}, BubbleScale -> "Diameter"], {n, 
  1, 10, 1}]

enter image description here

POSTED BY: Frederick Wu
7 Replies
Posted 10 years ago

Hi Sander,

Your ListPlot illustrates the data much clear. BubbleChart is an interesting function, maybe someone should report this issue to Wolfram Research?

POSTED BY: Frederick Wu

You can do that through the Wolfram portal. This is clearly unexpected behaviour!

POSTED BY: Sander Huisman
Posted 10 years ago

Hi Sander, The BubbleChart3D don't support dynamics, either.

I guess, it can be some new functions in Mathmatica 10, that don't support dynamics. They might know that already. That is why Wolfram Demonstration Project don't accept or update for version 10 as publish notebook.

POSTED BY: Frederick Wu
POSTED BY: Sander Huisman
Posted 10 years ago

Hi Sander,

You are right. I send Wolfram user portal a message to report the bugs.

POSTED BY: Frederick Wu

Hi Frederick,

This is indeed very very strange. If you compare the sizes you give and the ones plotted you get:

diam = Quiet@
     Cases[FullGraphics[
       BubbleChart[#, ChartStyle -> 24, BubbleSizes -> Automatic, 
        PlotRange -> {{0, 100}, {0, 100}}, 
        BubbleScale -> "Diameter"]], 
      Circle[{x_, y_}, r_] :> {x, y, r}, \[Infinity]] & /@ data;
Transpose[Map[Mean, diam[[All, All, 3]], {2}]] // ListPlot
Transpose[data[[All, All, 3]]] // ListPlot

enter image description here

So some very strange rescaling is done. If you want to animate, I'd say make your own bubbles using circle primitive, it is a couple of lines of code to make a simple bubblechart...

POSTED BY: Sander Huisman

Colors don't match btw. Just look at the trend of the individuals lines...

POSTED BY: Sander Huisman
Reply to this discussion
Community posts can be styled and formatted using the Markdown syntax.
Reply Preview
Attachments
Remove
or Discard