I've got some data, a subset of which looks like this:
fqData = {
   <| "Application" -> "Chess", "x" -> 9.0, "y" -> 2.5|>,
   <| "Application" -> "Drive", "x" -> 7.0, "y" -> 8.5|>

   };
I've mapped the x and y coordinates to a list, and used ListPlot to plot those points. But instead of seeing standard markers at each point, I would prefer to plot the actual label values, like "Chess" and "Drive", so something like the following, only with the correct labels in each place.
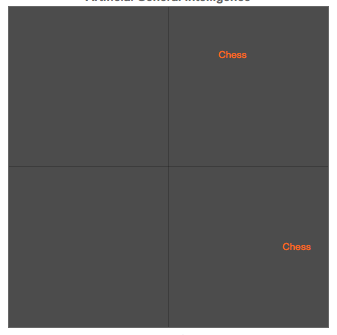
I thought PlotMarkers would do the trick for me (its how I got the above), but if you want to vary the plot markers, it only seems to apply to whole lists, so only useful in a situation where you are plotting a list of lists, where x axis values are assumed, and each point from a given sub-list is the same.
Any suggestions?
Thanks
Brad


