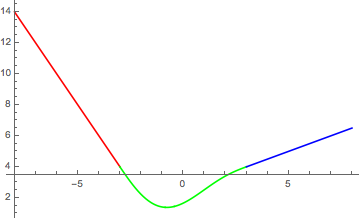
Yes, but it is a bit tricky. One way is with ColorFunction and ColorFunctionScaling:
f[x_] := Which[x <= -3, -2 x - 2, -3 < x < 3,
  0.0035 x^5 - 0.0058 x^4 - 0.1042 x^3 + 0.3125 x^2 + 0.6563 x +
   1.6563, x > 3, 0.5 x + 2.5]; Plot[f[x], {x, -8, 8},
 ColorFunction ->
  Function[{x, y},
   Which[x <= -3, Red, -3 < x < 3, Green, x > 3, Blue]],
 ColorFunctionScaling -> False]
Otherwise you can combine with Show three separate plots, each colored with PlotStyle, not forgetting a final PlotRange:
f[x_] := Which[x <= -3, -2 x - 2, -3 < x < 3,
  0.0035 x^5 - 0.0058 x^4 - 0.1042 x^3 + 0.3125 x^2 + 0.6563 x +
   1.6563, x > 3, 0.5 x + 2.5];
Show[
     Plot[f[x], {x, -8, -3}, PlotStyle -> Red],
     Plot[f[x], {x, -3, 3}, PlotStyle -> Green],
     Plot[f[x], {x, 3, 8}, PlotStyle -> Blue], PlotRange -> All]
