Group Abstract Group Abstract

Message Boards Message Boards

0
|
8.9K Views
|
10 Replies
|
6 Total Likes
View groups...
Share
Share this post:

Is it possible to plot multiple functions each in diffrent regions?

Posted 11 years ago

I want to plot three functions each in a diffrent region. The first function should only be drawn for x <= -3 (x less or equal to -3 ); the second one for -3 < x < 3 (x between -3 and 3) and the third one for x >= 3 (x greater or equal 3). And everything I tried only affacts all functions at the same time. I'm also really new to wolfram language so please be gentel with me.

Plot[{-2x-2,0.0035x^5-0.0058x^4-0.1042x^3+0.3125x^2+0.6563x+1.6563,0.5x+2.5},{x,-8,8}]
POSTED BY: Kevin Holm
10 Replies

You can restrict the domain of a function to be plotted with ConditionalExpression[]:

Plot[
 {ConditionalExpression[-2 x - 2, x <= -3],
  ConditionalExpression[
   0.0035 x^5 - 0.0058 x^4 - 0.1042 x^3 + 0.3125 x^2 + 0.6563 x + 1.6563,
   -3 < x < 3],
  ConditionalExpression[0.5 x + 2.5, x >= 3]},
 {x, -8, 8}]
POSTED BY: Michael Rogers

Suggest you define a Piecewise function based on your three functions, and plot that.

POSTED BY: Frank Kampas

But then colouring individual parts is not that easy...

POSTED BY: Sander Huisman

Perhaps using MapThread makes it easier:

funcs={-2x-2,0.0035x^5-0.0058x^4-0.1042x^3+0.3125x^2+0.6563x+1.6563,0.5x+2.5};
ranges={{-8,-3},{-3,3},{3,8}};
colors=ColorData[97]/@Range[Length[funcs]]
MapThread[Plot[#1,{x,#2[[1]],#2[[2]]},PlotStyle->#3]&,{funcs,ranges,colors}]
Show[%,PlotRange->All]

You create a series plot, each with a different function (funcs, #1) different plot range (ranges, #2), and different style (colors, #3). Then combine them together.

POSTED BY: Sander Huisman
Posted 11 years ago

Thanks, it defenetly works, now I just have to figure out how it works, it seems like magic at the moment. I just started using wolfram language yesterday. So at the moment I have no Idea what # syntax means. ;)

POSTED BY: Kevin Holm
POSTED BY: Sander Huisman

Can the same done for parametric plot? Kindly look at this question. Thanks in advance.

POSTED BY: Debojyoti Mondal

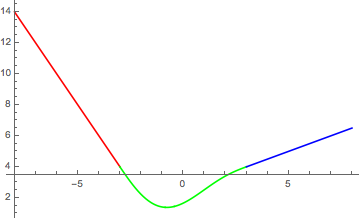
Yes, but it is a bit tricky. One way is with ColorFunction and ColorFunctionScaling:

f[x_] := Which[x <= -3, -2 x - 2, -3 < x < 3, 
  0.0035 x^5 - 0.0058 x^4 - 0.1042 x^3 + 0.3125 x^2 + 0.6563 x + 
   1.6563, x > 3, 0.5 x + 2.5]; Plot[f[x], {x, -8, 8}, 
 ColorFunction -> 
  Function[{x, y}, 
   Which[x <= -3, Red, -3 < x < 3, Green, x > 3, Blue]], 
 ColorFunctionScaling -> False]

Otherwise you can combine with Show three separate plots, each colored with PlotStyle, not forgetting a final PlotRange:

f[x_] := Which[x <= -3, -2 x - 2, -3 < x < 3, 
  0.0035 x^5 - 0.0058 x^4 - 0.1042 x^3 + 0.3125 x^2 + 0.6563 x + 
   1.6563, x > 3, 0.5 x + 2.5];
Show[
     Plot[f[x], {x, -8, -3}, PlotStyle -> Red],
     Plot[f[x], {x, -3, 3}, PlotStyle -> Green],
     Plot[f[x], {x, 3, 8}, PlotStyle -> Blue], PlotRange -> All]

enter image description here

POSTED BY: Gianluca Gorni

One simple way is to use Which:

Plot[Which[x <= -3, -2 x - 2, -3 < x < 3, 
  0.0035 x^5 - 0.0058 x^4 - 0.1042 x^3 + 0.3125 x^2 + 0.6563 x + 
   1.6563, x > 3, 0.5 x + 2.5], {x, -8, 8}]

enter image description here

POSTED BY: Gianluca Gorni
Posted 11 years ago

Thanks! Is there a way to color each of the equasions diffrently?

POSTED BY: Kevin Holm
Reply to this discussion
Community posts can be styled and formatted using the Markdown syntax.
Reply Preview
Attachments
Remove
or Discard