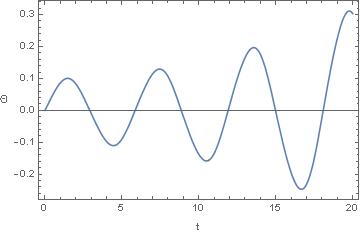
I am studying an equation which shows parametric amplification in a simple oscillator:
sv = NDSolveValue[{\[CapitalTheta]''[
       t] + (1 - 0.3 Cos[2*t]) \[CapitalTheta][t] ==
     0, \[CapitalTheta][0] ==
     0, \[CapitalTheta]'[0] == .1}, \[CapitalTheta], {t, 0, 20}];
A plot of this shows the expected increase in amplitude:
 Plot[{sv[t]}, {t, 0, 20},  Frame -> True,
     FrameLabel -> {"t", "\[CapitalTheta]"}, RotateLabel -> False,
     AspectRatio -> 1/GoldenRatio]
To study the parametric resonance, I used ParametricNDSolveValue to look at the dependence on the frequency of the pump wave:
sa = ParametricNDSolveValue[{\[CapitalTheta]''[
       t] + (1 - 0.3 Cos[\[Alpha] *t]) \[CapitalTheta][t] ==
     0, \[CapitalTheta][0] ==
     0, \[CapitalTheta]'[0] == .1}, \[CapitalTheta], {t, 0,
    20}, {\[Alpha]}];
But, the output from Plot3D looks completely unexpected (to me):
 Plot3D[sa[t][\[Alpha]], {t, 0, 20}, {\[Alpha], 1.9, 2.1},
     AxesLabel -> Automatic, PlotPoints -> 50]
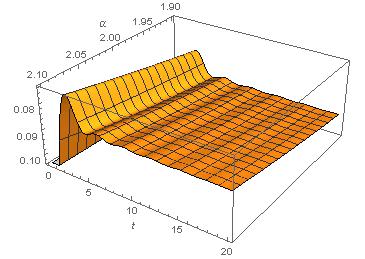
Some problems: * the values of theta plotted in the 3D image have a different range (varying between 0.1 and 0.08 instead of 0.3 and -0.3) * the values of theta generally decrease with time instead of increasing * the amplitude does not show a maximum near alpha=2.0 -- it is still increasing with alpha equal to 2.1
Having puzzled over this for a couple of days, I am hoping for assistance.
Steve Bardwell


