Message Boards Message Boards

0
|
8407 Views
|
3 Replies
|
0 Total Likes
View groups...
Share
Share this post:

Help refactoring and optimizing. Highlighting "highly composite" numbers.

I'm still very, very new to Mathematica and the Wolfram Language, and I suspect much of the code I'm writing is unnecessarily complex and repetitive. An example came up today with this Tweet. Since it's a "highly composite number day" (March 24th), I thought it would be fun to write some code to play with these numbers.

If[(Last[#] == Max[Table[Length[Divisors[d]], {d, First[#]}]] && 
     Count[Table[Length[Divisors[d]], {d, First[#]}], Last[#]] < 2), 
   Framed[#], #] & /@ Table[{n, Length[Divisors[n]]}, {n, 500}]

Is there a more efficient way to write code with this kind of structure? It just feels wrong to have to recalculate portions of the list for the sake of the comparison operators in the conditional to "highlight" the highly composite numbers.

Thanks!

POSTED BY: Christopher Fox
3 Replies
Posted 9 years ago

Hello Christopher,

this is my proposal: first generate a list holding n, Divisors of n and the Length of the list of divisors. Then you do a postprocessing (here executed by f1 and f2) and mark the "highly composite" numbers with a label (here "Red").

tab1 = Table[{n, Divisors[n], Length[Divisors[n]]}, {n, 1, 50}];
f1[{x_, max_}] := If[x[[3]] > max, {x, x[[3]], Red}, {x, max, White}]
f2[x_] := {y, max, color} = f1[{x, max}]
max = 0;
tab3 = Map[f2[#] &, tab1];
TableForm[tab3, TableDepth -> 2, 
 TableHeadings -> {None, {"n", "Divisors", "Len", "Color"}}]`
POSTED BY: Michael Helmle

I appreciate the reply, Luis, but this isn't quite what I'm after. I want to highlight the highly composite numbers in any given range starting at 1: so, not only do you need to generate the divisors for each integer in the range, you also need to check whether or not it is "highly composite". I'm thinking there has to be a better way than to have to generate portions of the same list three times.

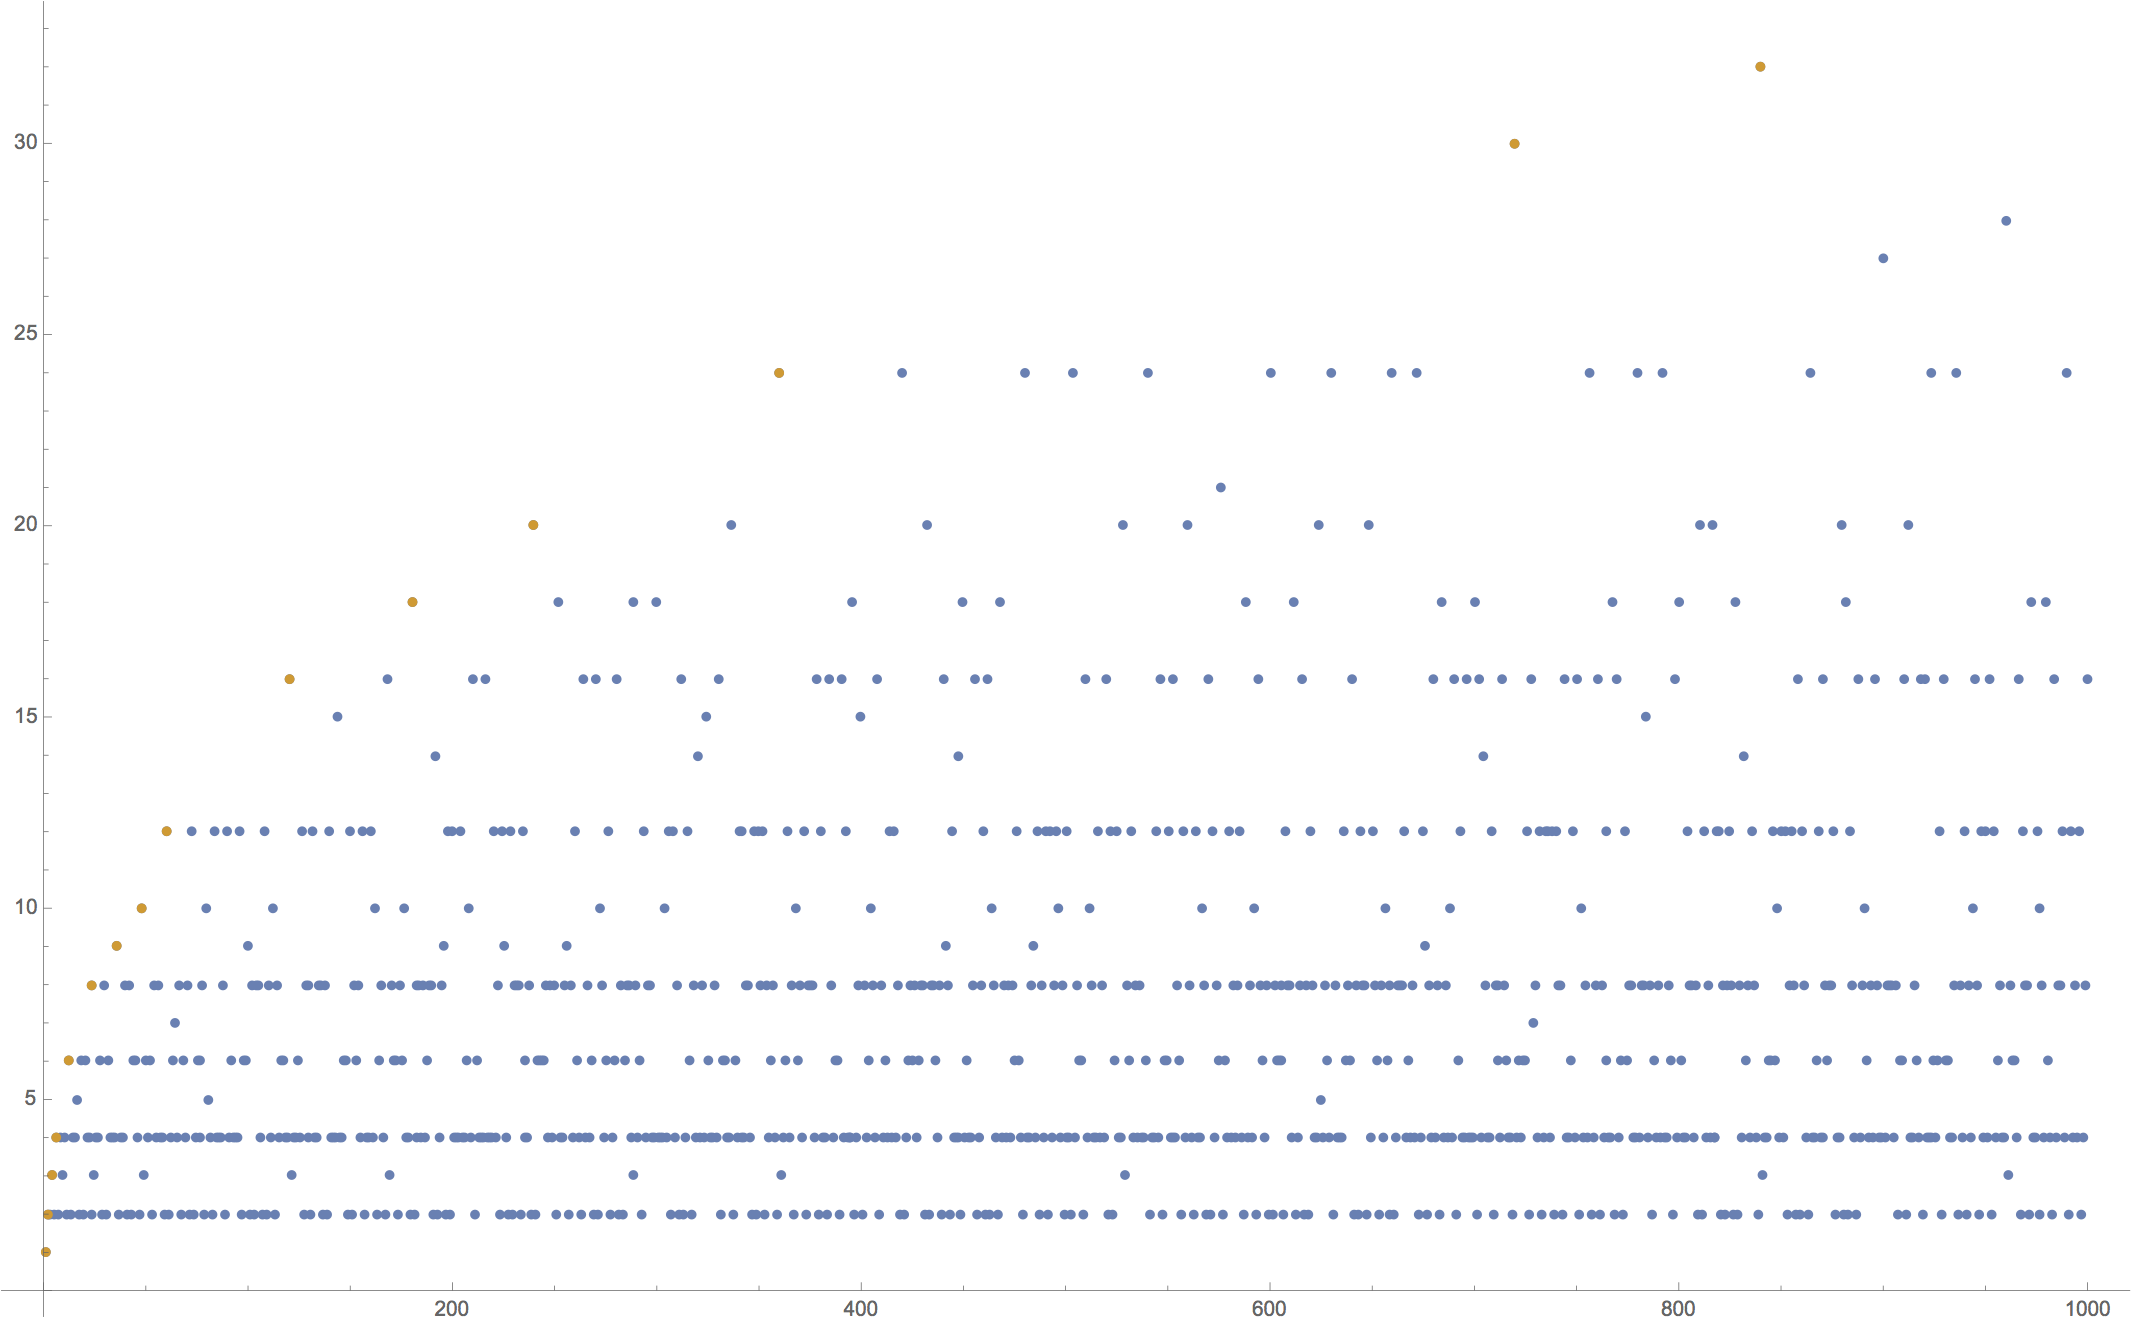
As another example, suppose we wanted to see a ListPlot of each integer (the X axis) with its number of divisors (the Y axis), and on the same plot style the points for the highly composite numbers differently.

ListPlot[{Table[Length[Divisors[n]], {n, 1000}], 
  Tooltip[Select[
    Table[{n, Length[Divisors[n]]}, {n, 
      1000}], (Last[#] == 
        Max[Table[Length[Divisors[d]], {d, First[#]}]] && 
       Count[Table[Length[Divisors[d]], {d, First[#]}], Last[#]] < 
        2) &]]}, ImageSize -> Full]

listplot graph generated from code above

As you can see, I'm having to generate the full table or portions of it four times. I'm just looking for ways to optimize this type of code structure.

Thanks again for your comment and reply.

POSTED BY: Christopher Fox
Posted 9 years ago

I think this can help you. I did it to show you what number is the one with more divisors, which as really effectively is 24, you can improve it, cheer up.

exa = {#, Length[Divisors[#]]} & /@Range[2, 24]

TableForm[Sort[exa, #1[[2]] > #2[[2]] &], 
 TableHeadings -> {None, {"Number", "Total divisors"}}]

Here is a picture. It show you the result of the code.

result

POSTED BY: Luis Ledesma
Reply to this discussion
Community posts can be styled and formatted using the Markdown syntax.
Reply Preview
Attachments
Remove
or Discard

Group Abstract Group Abstract