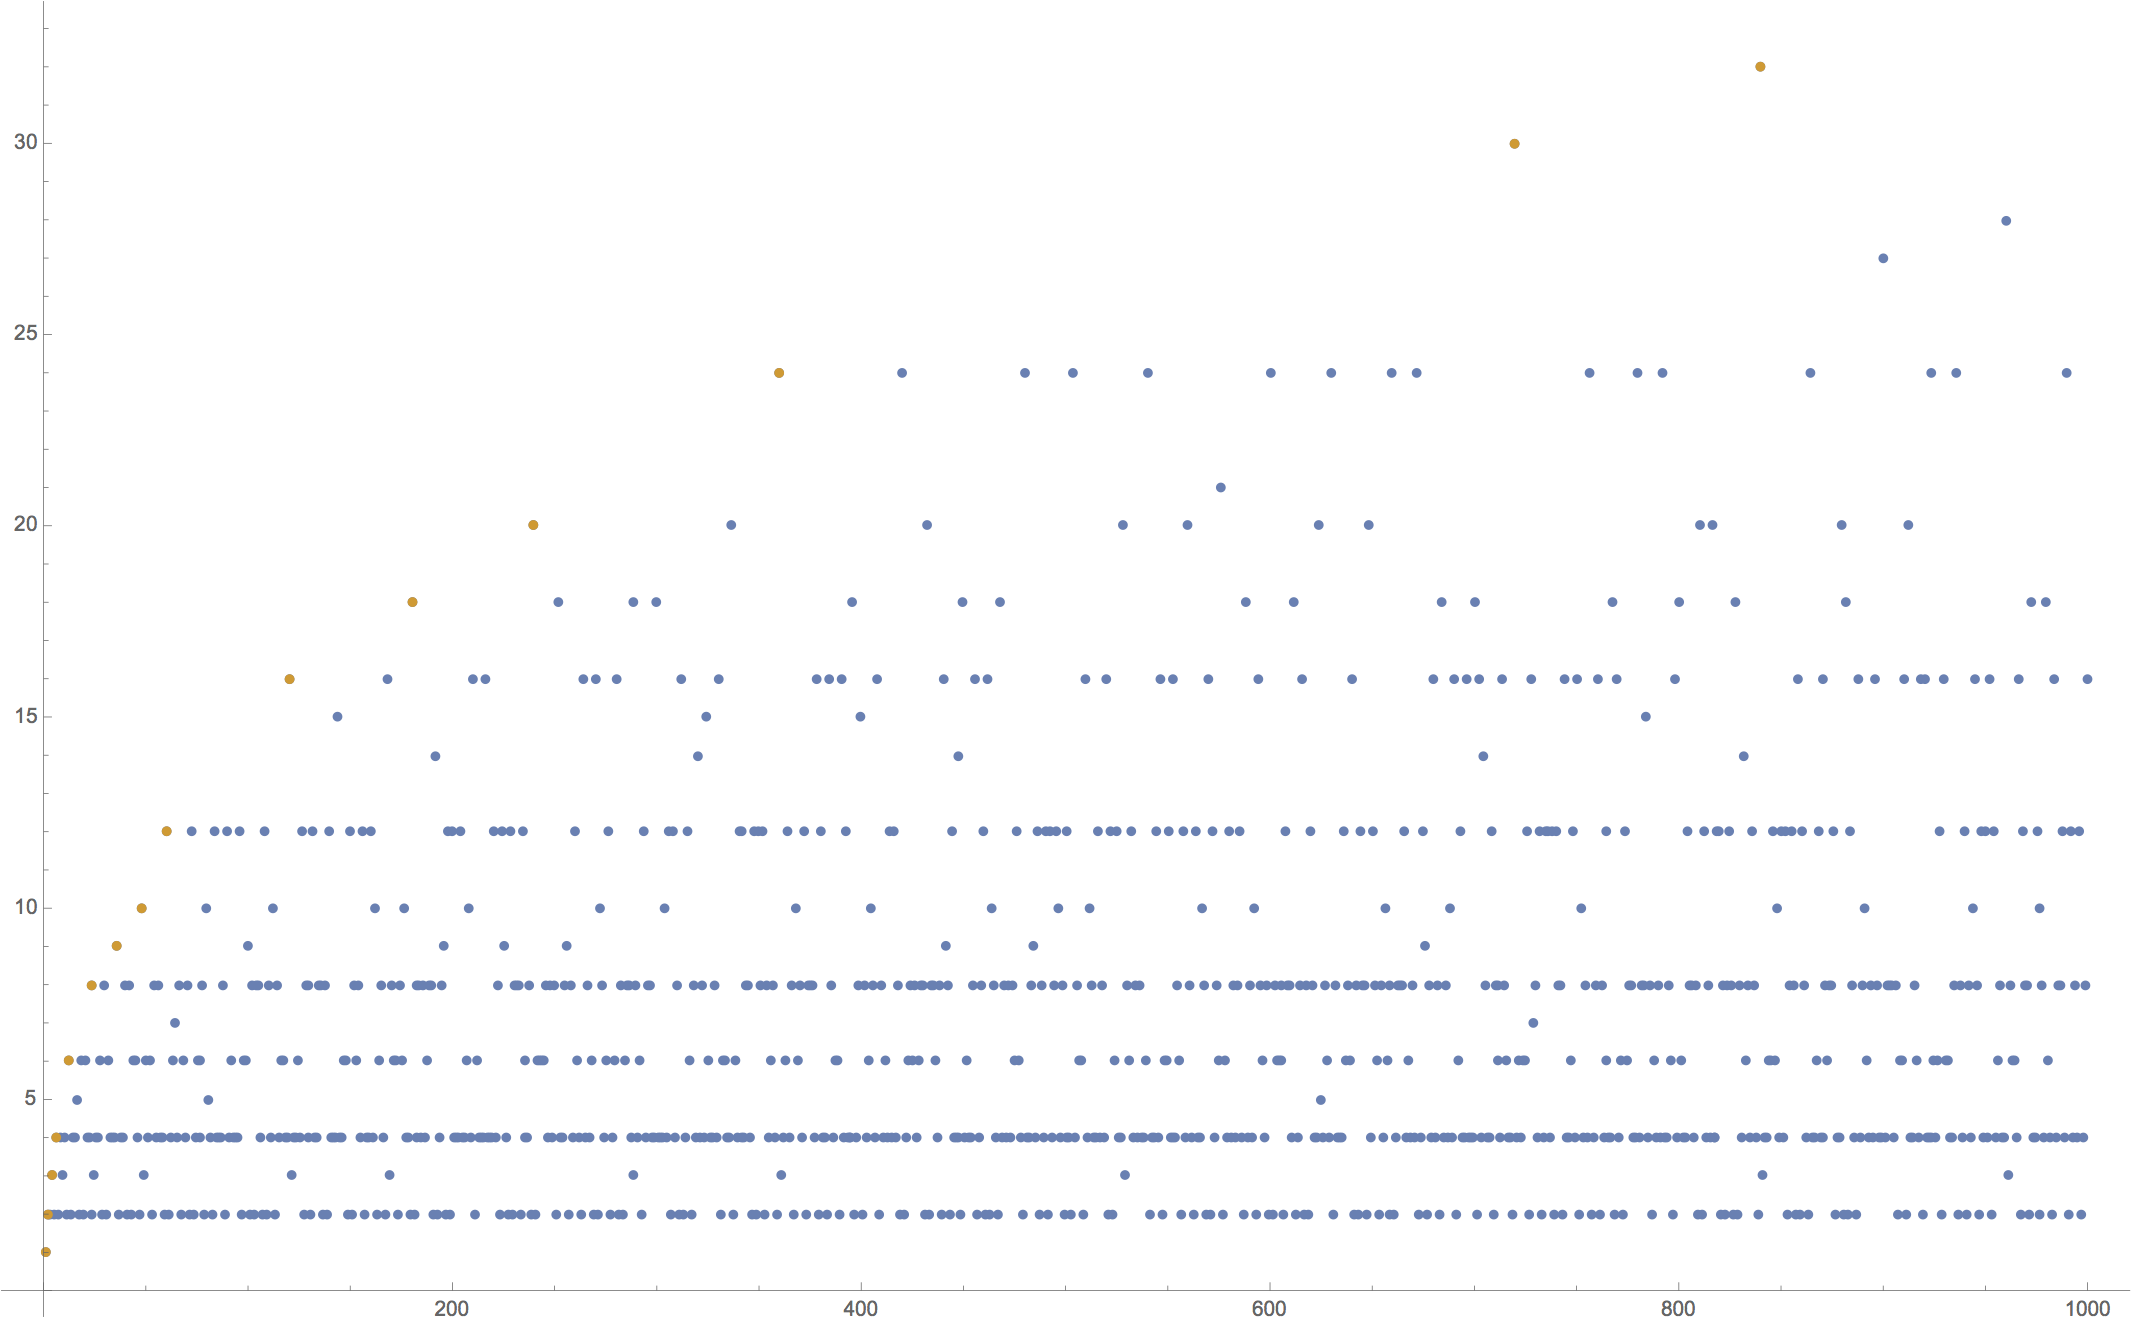
I appreciate the reply, Luis, but this isn't quite what I'm after. I want to highlight the highly composite numbers in any given range starting at 1: so, not only do you need to generate the divisors for each integer in the range, you also need to check whether or not it is "highly composite". I'm thinking there has to be a better way than to have to generate portions of the same list three times.
As another example, suppose we wanted to see a ListPlot of each integer (the X axis) with its number of divisors (the Y axis), and on the same plot style the points for the highly composite numbers differently.
ListPlot[{Table[Length[Divisors[n]], {n, 1000}],
  Tooltip[Select[
    Table[{n, Length[Divisors[n]]}, {n,
      1000}], (Last[#] ==
        Max[Table[Length[Divisors[d]], {d, First[#]}]] &&
       Count[Table[Length[Divisors[d]], {d, First[#]}], Last[#]] <
        2) &]]}, ImageSize -> Full]

As you can see, I'm having to generate the full table or portions of it four times. I'm just looking for ways to optimize this type of code structure.
Thanks again for your comment and reply.