Group Abstract Group Abstract

Message Boards Message Boards

0
|
9.1K Views
|
2 Replies
|
0 Total Likes
View groups...
Share
Share this post:

WSMPlot returns empty plot when plotting sensitivities

Posted 10 years ago

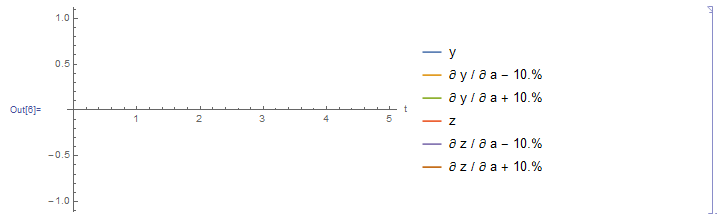
While playing around with WSMLink, I've encountered an issue where WSMPlot returns and empty plot when plotting sensitivities. Plotting other simulation variables works fine. Here's an example right out of the WSMLink documentation for WSMSimulateSensitivity:

mmodel = "MathematicaExamples.Basic.DiffEq";

\[ScriptCapitalM] = WSMSimulateSensitivity[mmodel, {0, 5}, {"a"}]

WSMPlot[\[ScriptCapitalM], {{"y", "a", 0.1}, {"z", "a", 0.1}}]

Sensitivity Plot 1

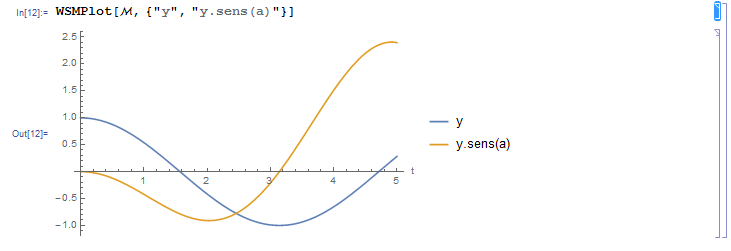
However, this works fine:

Sensitivity Plot 2

Any ideas about what is going on? I'm running Mathematica 10.4.1 and SystemModeler 4.0.1 on Windows 10.

POSTED BY: David G
2 Replies
Posted 10 years ago

OK, thanks. I'll use the workaround until I can upgrade.

POSTED BY: David G

This is a bug when using a combination of an old SystemModeler and certain versions of Mathematica. Upgrading SystemModeler to a newer version (4.1 or newer) should fix the issue, or you can use this workaround:

WSMPlot[\[ScriptCapitalM], {{"y", "a", 0.1}, {"z", "a", 0.1}}, 
 PerformanceGoal -> "Speed"]
POSTED BY: Malte Lenz
Reply to this discussion
Community posts can be styled and formatted using the Markdown syntax.
Reply Preview
Attachments
Remove
or Discard