There has been a lot of inquiry into how to create usable and searchable databases using Mathematica. I will attempt to do my best to detail how to go about doing something like that here.This process is intended to accomplish the tasks listed bellow. I have attached the CSV containing the data used and the corresponding notebook to this post.
Using the Wolfram Language import the data according to the named fields and create a data set
Create a form to search by name through the data set and return a notebook with a summary of the person's information
Create a form to search by zip code or city, state to locate and plot each person living within a 100 mile radius
It is relatively straightforward to generate a dataset object from such a neatly organized excel spreadsheet using SemanticImport[].
data = SemanticImport["C:\\Users\\YottaTech\\Desktop\\us-500.csv"]
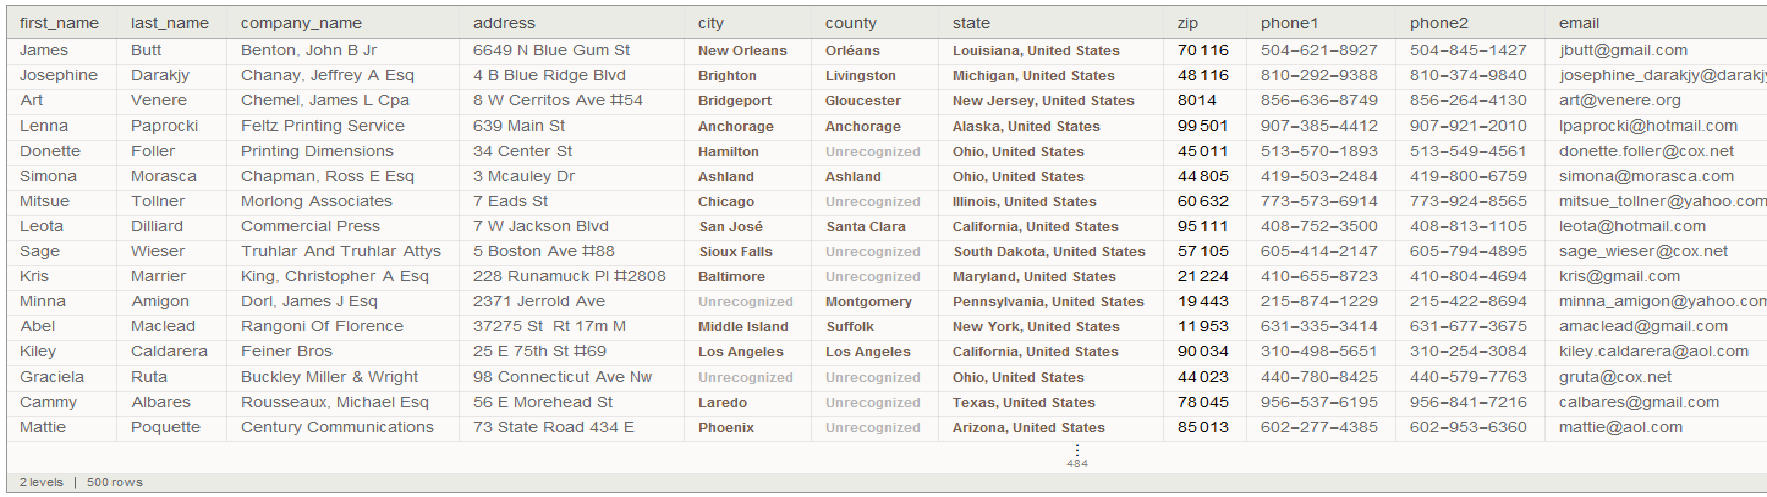
Search the first element of the database and look at the entry
data[1]
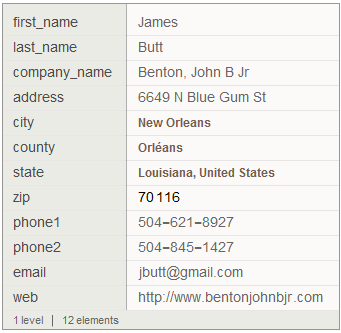
Take the first name of the first entry utilizing the association keys
data[1]["first_name"]
"James"
It was not explicitly stated whether it was to be searchable by first, last, or full name. So I made a function for each that creates separate lists of all the first, last, and full names search through for patterns
firstNames = Table[data[i]["first_name"], {i, 1, Length[data]}];
lastNames = Table[data[i]["last_name"], {i, 1, Length[data]}];
fullNames =
  Table[StringJoin[data[i]["first_name"], " ",
    data[i]["last_name"]], {i, 1, Length[data]}];

We now understand the data enough to make a function to parse through it for patterns.The SearchNameFunction takes a primary argument of the name and a secondary optional argument of the type of name you are submitting. If you don' t specify this option it will assume you are search by the person' s "Full" name. You can specify to search by either "Last" or "First" names as well.
SearchNameFunction[name_, type_: "Full"] :=
 Module[{positions, names},
  (
   Which[
        type == "Full",
        names = fullNames
    ,
        type == "First",
        names = firstNames
    ,
        type == "Last",
        names = lastNames
    ];
   positions = Flatten@Position[names, name];
   data[#] &@positions
   )
  ]
SearchNameFunction["Ruta", "Last"]

Search a user by their full name name - notice we don' t need to specify the type of the name for this method
SearchNameFunction["Art Venere"]

Create a FormFunction that takes in the name as a string from the form and passes it to the SearchNameFunction[]
form = FormFunction[{"name" -> "String"},
   SearchNameFunction[#name] &];
Run the form[] function and input the name you would like to search
form[]
Now I will go about visualizing the data meaningfully. I tried using the exact addresses but Mathematica didnt like the interpreter for that very much so I instead opted to use cities and zip codes.The only real issue I had when parsing the information given in the excel file was that a lot of the cities and zip codes were missing or corrupted. In order to make a working prototype that would effectively parse ALL users I decided on making a hierarchy where we would use whatever their location. This seemed to work well enough for the application in question.
This function takes a location input as either zip code or a city and plots points for every entry within a 100 mile radius of the location. This range can be changed as an optional variable but is automatically set to 100.
SearchCityFunction[locationInput_, range_: 100] :=
 (

  peoplesLocations =
   Module[{zip, location, output, disk},

    (*If the locationInput is all numbers consider it to be a zip code, else it will be interpreted as a city*)
    If[DigitQ[ToString@locationInput],
     location = ZIPCodeData[ToString@locationInput, "Coordinates"],
     location = Interpreter["Location"][locationInput],
     ];

    (*Starting with the zip code check if the entry is within 100 miles of the location Input.
    If the zip is missingor invalid use the city, if the city is missing or invalid use the state.
    Would be worth looking into though if the entry is within 100 miles store it, else do nothing. *)

    ParallelTable[
     If[
      GeoWithinQ[disk = GeoDisk[location, Quantity[range, "Miles"]],
       output =
        If[MissingQ[
          zip = ZIPCodeData[ToString@data[i]["zip"], "Coordinates"]],
         If[MissingQ[data[i]["city"]],
          data[i]["state"]["Coordinates"], data[i]["city"]],
         zip]]
      ,
      output
      ,
      Nothing]
     , {i, 1, Length[data], 1}]];

  (*Plot the stored locations on a geographic map*)
  GeoGraphics[{Red, PointSize[Large],
    Point[GeoPosition[peoplesLocations]]}]
  )
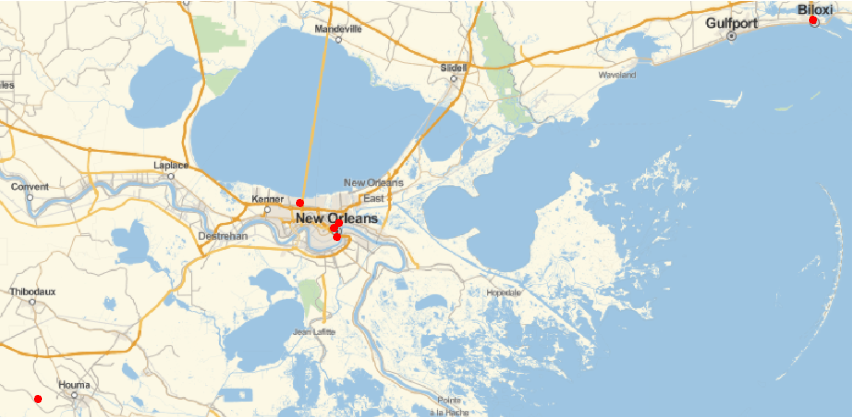
Run test function for a zip code near New Orleans (Where i am from!)
SearchCityFunction[70433]
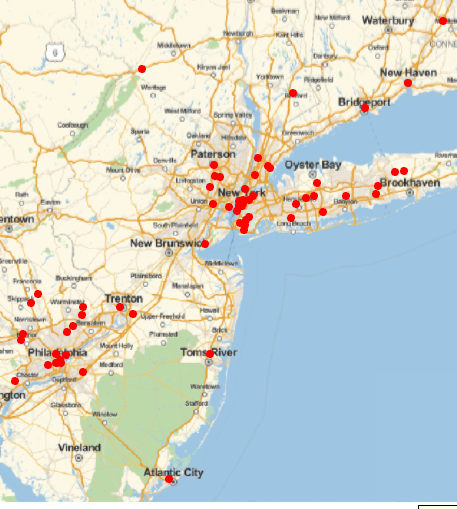
SearchCityFunction["New York"]
Create a FormFunction that takes in the name as a string from the form and passes it to the SearchCityFunction[] and test it.
form = FormFunction[{"location" -> "String"},
   SearchCityFunction[#location] &];
form[]
I know there is probably a lot better ways to go about doing this but I thought it was an interesting project! Let me know what you think and how I could go about optimizing the process I laid down.
 Attachments:


