Hi! I would like to use DistributionChart but I do not like the fact
that the smoothed distributions it produces have a larger support then they should
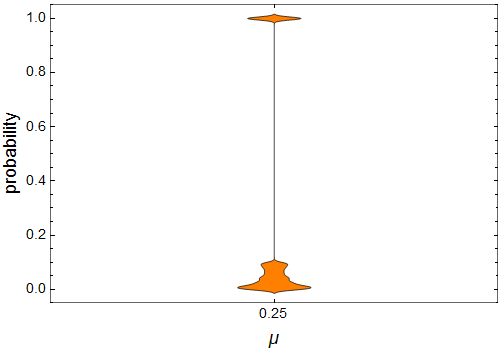
(for example see the picture below, where all the input numbers lie within range $[0,1]$ - as you would expect of probability or any other normalised quantity - but the distribution, y-axis, goes visibly below 0 and above 1.)
Using
ChartElementFunction ->"HistogramDensity"
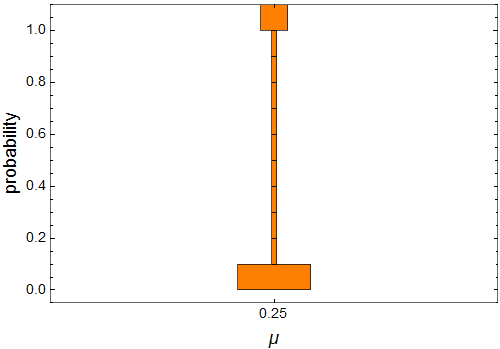
produces a more faithful version, with bin boundaries from $[a, b)$, which only has the problem that all ones lie in an interval $[1,1+\epsilon)$.
Question
(How) can I set up the number of bins of a histogram which is computed by DistributionChart:
DistributionChart[data, ChartElementFunction ->"HistogramDensity"]
Follow-up question
Which of the Histogram binning methods is used by default in DistributionChart?


