Wanted to share this dashboard of patient demographics to illustrate how easy it can be (often) to organize and display data provided it is imported and indexed - using techniques like recursive trie shown earlier and using helpers like keyGroupBy.
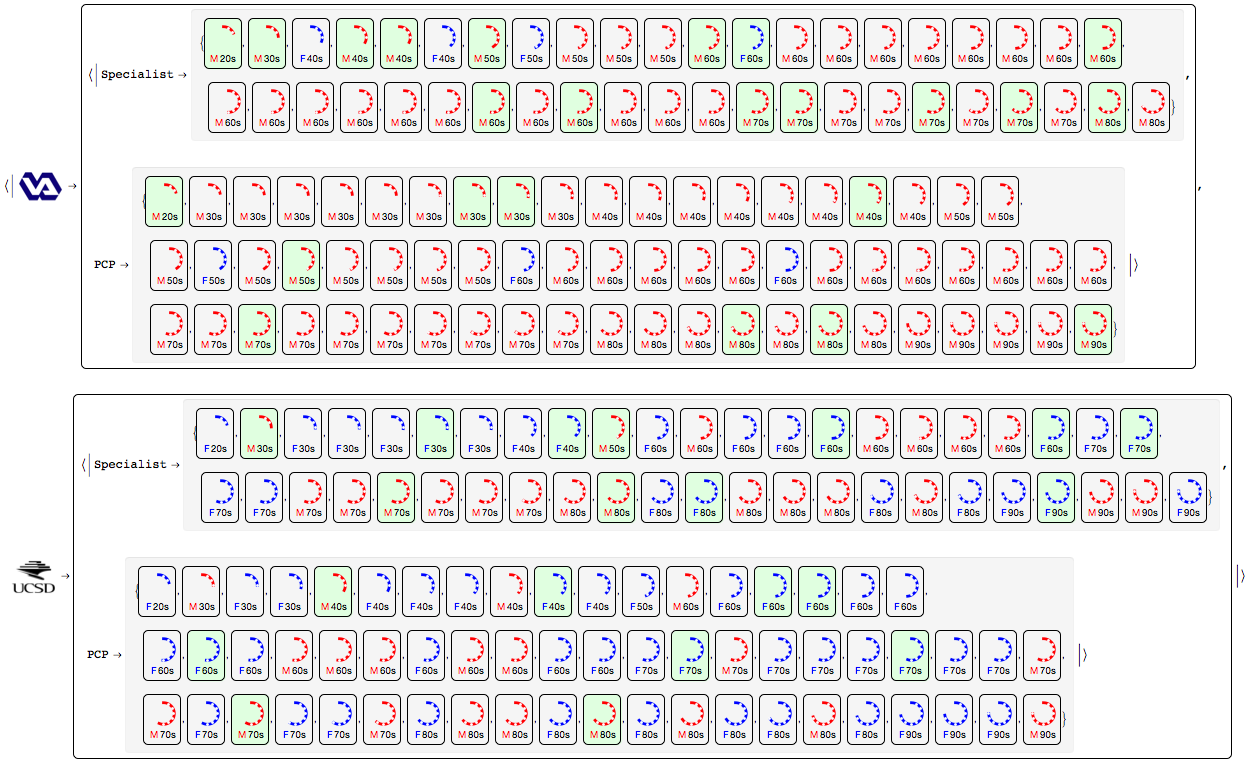
In this dashboard, each square represents a patient in our Quick time-motion study of computer use during office visits. They are grouped hierarchically
- by Site (VA San Diego HS and UCSD HS) - shown as icons
- by Primary/Specialty care
See "Preattentive Recognition as discussed in Colin Wares book Information Visualization : It is a lot easier to compare groups visually than if you were to read the labels only // Note gender skew to Male at VASD - but not much diff in age groups b/w sites.
Green patients are New (versus Established) - to the doctor.
Starting with data imported and indexed from spreadsheets in Google Drive ( so that the entire research team can co-edit) the entire query is only a few lines:
quick[data]["Demographics", "Patient", quick[visits] /* SortBy["Age"],
    Framed[ lifespanCircleGr[#Gender, #Age],
     Background -> Replace[#Status, {"New" :>  LightGreen}]] &][
  keyGroupBy[quick[patient2site]] /* KeyMap[quick[icons]] /*
   Map[keyGroupBy[quick[patient2specialtyGroup]] /*
     Map[Values /* Panel] /* Framed]] // Normal
Rather than detail specifics, will mention only that most data with Head quick like quick[patient2site], are associations, eg:
quick[patient2site] // Normal
<|"Q005" -> "VASD", "Q006" -> "VASD",..., "Q223" -> "UCSD"|>
and that such associations can be nested by composition eg, patient --> doctor --> specialty.
Here's the code for the lifespan wheel - which closes at 120 y.o. (oldest living human is 122)
lifespanCircleGr[gender_, age_] :=
 Graphics[{{lifespanGenderColor [gender], Thickness[0.1],
     Circle[{0, 0}, 1, {0, -2 Pi age/120} + Pi/2]}, {White,
     PointSize[0.1],
     Table[Point@AngleVector[-2 Pi t/120 + Pi/2], {t, 10, age, 10}]}},
    PlotRange -> 1.3 {{-1, 1}, {-1, 1}}, ImageSize -> 30] //
  Labeled[#, {<|"F" -> "F", "M" -> "M", "Female" -> "F",
         "Male" -> "M"|>[gender] //
       style[lifespanGenderColor [gender]],
      ToString[10 Round[age/10]] <> "s"} // row[" "], Bottom] &
Where gender is a string that can be handled in various ways for flexibility:
lifespanGenderColor = <|"F" -> Blue, "M" -> Red, "Female" -> Blue, "Male" -> Red|>


