Group Abstract Group Abstract

Message Boards Message Boards

3
|
17.7K Views
|
3 Replies
|
4 Total Likes
View groups...
Share
Share this post:

Native Treemap Visualization on Mathematica

Posted 13 years ago
Hi All. I would like to suggest that Treemap could be incorporated as a new plot function on Mathematica. It's a very interesting form of visualization, that could add to current plot functions. I know about this demonstration and this SE post but it's very hard to use the code for new data. I belive that a native function would be great.

POSTED BY: Rodrigo Murta
3 Replies

I think that sooner or later the Treemap will have to be added. While doing a Power Bi training I understood its importance. It is basically the new PieChart that overcomes these two problems:

  1. When the data has numbers much smaller than others they become nearly invisible. This can still happen with treemaps but not as easily.
  2. The human vision is not good at detecting small angular differences.

There is probably a better reference in support of this, but this is one I just found:

https://yurbi.com/blog/treemaps-vs-pie-charts/

POSTED BY: Gustavo Delfino
Out of curiosity, in what form is the data you'd like to use a tree map to visualize?
POSTED BY: Brett Champion
Hi Brett, in my case, I would use it to visualize Product Category Tree. The structure is Departament, Sector, Group and Subgroup, all nested inside each other.
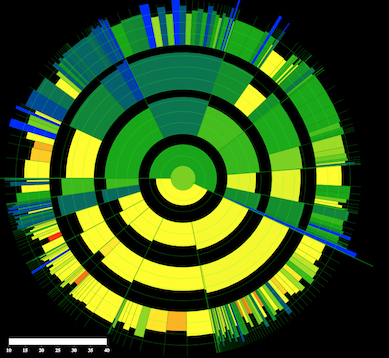
Today I can see it using SectorChart like the figure below, and it would be nice to see it in a Treemap.
POSTED BY: Rodrigo Murta
Reply to this discussion
Community posts can be styled and formatted using the Markdown syntax.
Reply Preview
Attachments
Remove
or Discard