Hi.
I just got started in Mathematica, so my knowledge regarding the software is pretty limited. Okay, that's an euphemism, what I meant is "I suck at it and need help." I'm struggling to plot the real part of the velocity profile for pulsatile flow in a rigid tube. The normalized equation that I need to plot is this one,

where r is the radial distance from the tube axis, t is the time, capital lambda is a function of the unsteady Reynolds number capital omega, 
and zeta is a normalized radial coordinate,

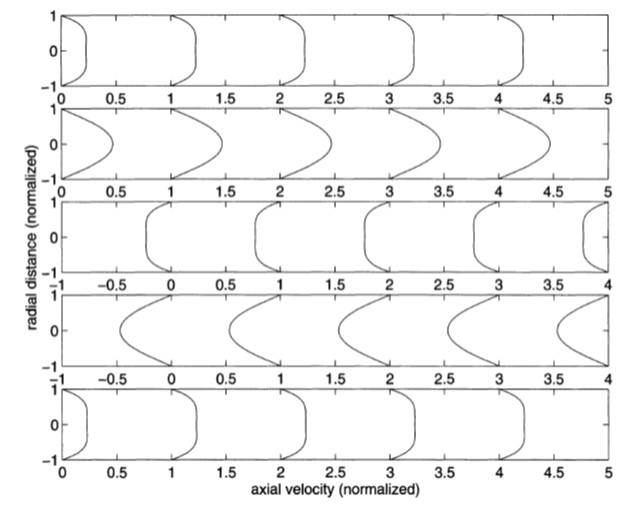
R being the radius of the tube. J0, of course, is a Bessel function of the first kind and order zero. When the real part of the equation is plotted for a fixed unsteady Reynolds number (capital omega) = 3.0 at different phase angles omega*t, starting from 0 and then increasing by 90º each time, I'm supposed to find something like this,
This is a little too ambitious for me, so I'm just looking to plot this thing for a fixed phase angle omega x t, so that I can worry about finding the graph of u as a function of zeta only. I programmed the pertaining variables in many different ways and tried a command of the form Plot[ Re[] ], but I keep getting an empty graph. Mathematica says my function doesn't have a real part at all. Any help would be appreciated. Thanks in advance.


