Mathematica has quite a reputation as a tool for data analysis. However, in my field (Educational Research) people mostly use R, STATA and SPSS for data analysis. When I was offered a place in the Wolfram Summer School of 2016, my goal was doing the kind of analyses that are usually done with those platforms in order to develop educational materials in Mathematica for learning statistics. I thought it would be a good idea to start doing some previous work so I could make more during the summer schools. So I tried to do a simple t-test in Mathematica, something that it is very easy in theory. For example, given that you define two data sets, say data1 and data2, all you need to do is typing:
PairedTTest[{data1, data2}]
And thats it. You get a p-value for the null hypothesis that there is no difference between the means. Its simple and elegant, once you have defined data1 and data2, but thats not how the world works. Usually what you have is data set in a spreadsheet kind of file like this:
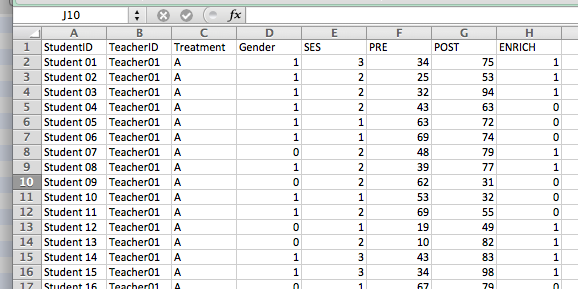
This is a simulated data set with the typical (idealized) structure educational research data has. There are students with unique identifiers that are assigned to teachers, a certain treatment (say a different teaching methodologies A, B and C) and for the students we have their gender, Socioeconomic status (SES), the scores of students in an appropriate test before the interventions started (PRE), the corresponding scores after the intervention (POST) and a categorical outcome variable (ENRICH) indicating whether students would be assigned to an enrichment program based on their improvement or their post-test scores.
When thinking about analyzing this data, eeveral questions came to my mind:
- a) How was I going to get from the spreadsheet file to Mathematica?
- b) What would happen with the names of my variables?
- c) Would Mathematica understand that there is an association between students and their data?
After overcoming a phase of frustration where I thought the answers to these questions were:
- a) Yes you will, but it will take so much time and effort that why even bother, abandon Mathematica; do it in R best
- b) You will have to rename everything dropping the initial capitalization
- c) No
With the help of peers and my advisors at the summer school I was able to respond positively each of those questions and eventually, once the suitable objects were defined (something which is not difficult) I was able to do t-tests, ANOVAs, linear and logistic regressions, and learned how to select and manipulate variables in my data file without changing their names.
This is what this project is about: doing statistics with Mathematica in an authentic context. For my project, I took a couple data sets and by using SemanticImport and Mathematicas pattern recognition capabilities, I was able to analyze them in an intuitive and relatively simple way using a few lines of code. The imported data set in Mathematica looks like this:
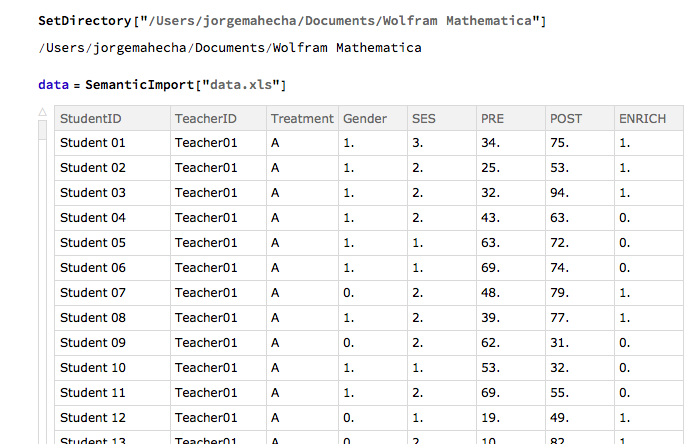
Once the data is imported into Mathematica (I suggest using an .xls as a source file to avoid issues of text conversion between operating systems), you can do all sorts of things in a relatively simple way:
Mean[data [All, PRE]]
Mean[data [All, POST]]
Those two commands give you the mean for the pre-test scores and the post-test scores in these data set that simulates the training of 20 teachers in three different pedagogical approaches. Each of these 20 teachers has between 17 and 24 students of different gender and socioeconomic statuses. It is a typical experimental setting whit two outcomes: the post-test scores, which is continuous, and the binary categorical ENRICH variable, meaning if the student was selected for a special enrichment program based on their score in the post-test.
Some example lines of command that were useful in this project are:
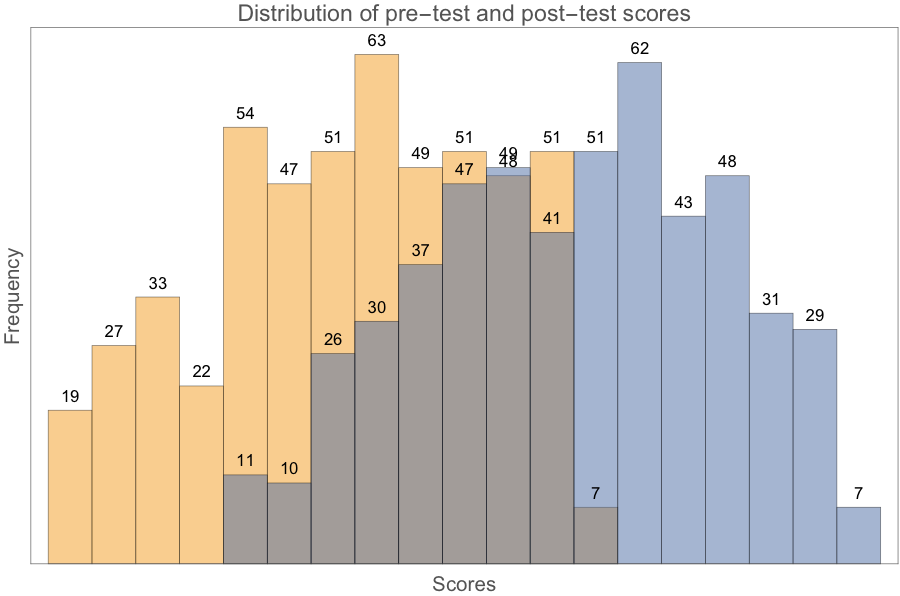
Histogram[{pretestScores, posttestScores} (and then some options) ]
This line generates a histogram of the pre-test and post-test scores:
Having defined the object data before, different variables (columns) can be further defined:
sesPOST = Values[data[All, {"SES", "POST"}]] // Normal;
Doing an ANOVA to see whether there are differences in the post scores associated with socioeconomic status is as simple as writing this:
ANOVA[sesPOST]
And then you get results like: 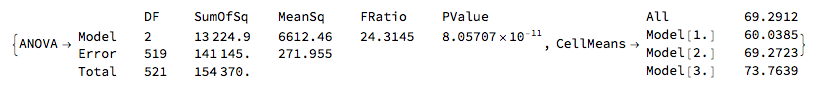
Treatments do not even have to be codified as numbers. After defining the object postSCORES, a list of all the post-test scores by treatment:
postSCORES = Catenate[{tAscoresPOST, tBscoresPOST, tCscoresPOST}]
An ANOVA with post-tests can be done by:
ANOVA[postSCORES]
And then you get results like: 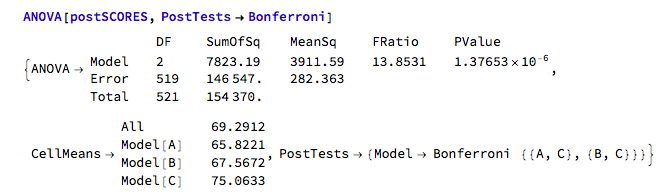
The possibilities are endless. My project only involved a small set of basic statistical procedures, but there are many more to try. In the end, my goal doing the kind of analyses that are usually done with those platforms in order to develop educational materials in Mathematica for learning statistics was met. I produced a small tutorial that hopefully would be useful to others interested in broadening their software repertoire for data analysis.


