Thunderstorm Analyzer

ABSTRACT:
Every moment our bodies are penetrated by cosmic rays. Those are tiny little particles which are coming from the rest of the universe and they can affect air and ground communication as well as airplane navigation. It was observed that during thunderstorms number of this particles increases. We know that those excess number of particles are not coming from space, because they occur only during atmospheric events so they should be generated inside the thundercloud.
Scientists at Alikhanyan National Science Laboratory (Yerevan Physics Institute) came up with a theory which explains why this is happening and the goal of this project is to test it and create a system which will analyze atmospheric properties like electric field, number of electrons, neutrons, muons and gamma rays taken from public weather server of Yerevan Physics Institute and study their temporal correlation to detect the cases of additional particle creation in a process called Thunderstorm Ground Enhancement (TGE).
Theory
It was long known that there are big charge concentrations in thunderclouds because of static electricity generated when super-cooled water droplets are colliding with ice crystals because of which charge constantly builds up until lightning will not happen between any areas of thundercloud or between cloud and ground or the thundercloud will not disperse. This can be observed by measuring overall electric field near earth surface. Usually the electric field near ground is at the levels of 0.2 - 0.5 kV/m during bright weather, but during thunderstorms that number can rise with absolute magnitude to the levels of 60 - 70 kV/m. When lightning happens charge distribution within the cloud changes and simultaneously the magnitude of overall electric field near ground falls down immediately. The idea is that there is a big potential difference between earth surface and thundercloud thus charged particles from cosmic rays can accelerate during propagation through the air and clouds with strong atmospheric electric fields. We know that when charged particles moves with acceleration they emits radiation (gamma rays) thus loosing energy and eventually stopping, but if external electric field will be higher of some certain value the energy gain from external field will be higher than energy looses from gamma ray emissions, those electrons will continue to propagate with positive acceleration and kicking off electrons from air atoms. Those kicked off atoms on their turn will continue to do the exact same thing, like in chain reaction. Eventually in the end it will end up with particle shower when only couple of electrons will generate great amount of electrons and gamma rays. This process is called a Thunderstorm Ground Enhancement (TGE). The TGE events are characterized by following 7 criteria:
- Large fluxes of electrons and gamma rays with duration around 10 minutes;
- Increase in neutron number;
- Microsecond electron bursts with around 50ms duration;
- Increase of high energy muon level;
- Large, usually negative, near-surface electric field, rising sometimes from deep negative to near zero positive values. Usually field is at the level of -10 - -30 kV/m;
- Decrease of the cloud-ground lightnings and increase of intra-cloud lightnings.
- Increase of relative humidity above 80% and decrease of air temperature below 5 - 6* Celsius.
The system should analyze all the data and look for this kind of events and notify us upon their occurring.
Import Weather Data from csv file.
First thing we should do is to import weather data downloaded from weather server. After importing, we should format all the data and transform them to standard form so it will be easier to work with them. This function takes the name of a file as an argument and imports it's content. dataImporter DeleteCases[ Delete[ Import[ StringJoin[ NotebookDirectory[], filePath ] ], 1 ], "", {2} ], (Length[#] == nOfColumns)& ];
By default, date column in csv file has a format of "Day[type: Numeric] - Month [type: string] - Year[Type: Two digit Numeric] H:M:S". Because later we should create a time series we need to change date format to "y, m, d, h, m, s". Pay attention that all parts of date are Numeric and the date is a 4 digit numeric.
dateFormater[inputList_] := Replace[
    Part[
        MapAt[
            ToExpression,
            ReplaceAll[
                StringSplit[
                    inputList,
                    ":" | " " | "-"
                ],
                monthRule],
            {All,{1,2,3,4,5,6}}
        ],All, {3, 2, 1, 4, 5, 6}
    ],
    {year_, rest__} :> {year+2000, rest},
    {1}
];
monthRule is a Rule that transforms string names of months to their numeric representations. For example January -> 1, February -> 2, etc..
Now we should import data of different detectors and perform some transformations on them. Import data of Electric Field Meter. electricFieldFull = dataImporter["Weather Data (05.Jul - 07.Jul.16)\ElectricFieldMAKET.csv", 2];
electricFieldFullConverted = Transpose[{dateFormater[electricFieldFull[[All,1]]], electricFieldFull[[All,2]]}];

electricField = Part[
    electricFieldFullConverted,
    Position[
        electricFieldFullConverted,
        {2016, 7, 6, 8, 32, 45.`}][[1, 1]] ;; Position[electricFieldFullConverted, {2016, 7, 6, 8, 34, 15.`}][[1, 1]]
];
Import STAND Electron and Gamma ray Detector Data:
stand1Raw = dataImporter["Weather Data (05.Jul - 07.Jul.16)\\Stand_1cm.csv", 13];

stand1 = Transpose[{dateFormater[stand1Raw[[All,1]]],stand1Raw[[All,2]]}];
stand1Normalized = Transpose[{dateFormater[stand1Raw[[All,1]]],N[Rescale[stand1Raw[[All,2]],{Min[stand1],Max[stand1]},{0, 20}]]}];
Import NaI Electron and Gamma ray Detector Data
naIFull = dataImporter["Weather Data (05.Jul - 07.Jul.16)\\NaI.csv",19];
naIFull = naIFull[[4;;]];

naI3 = Transpose[
    {dateFormater[naIFull[[All, 1]]], naIFull[[All, 3]]}
];
Import temperature and humidity data:
weatherData = Select[
    Delete[
        Import[
            StringJoin[NotebookDirectory[],"Weather Data (05.Jul - 07.Jul.16)\\Weather_Station.csv"]
        ],
        1
    ],
    (Length[#] == 37)&
];
temperature = Transpose[{dateFormater[weatherData[[All, 1]]], weatherData[[All, 2]]}];
humidity = Transpose[{dateFormater[weatherData[[All, 1]]], weatherData[[All, 5]]}];
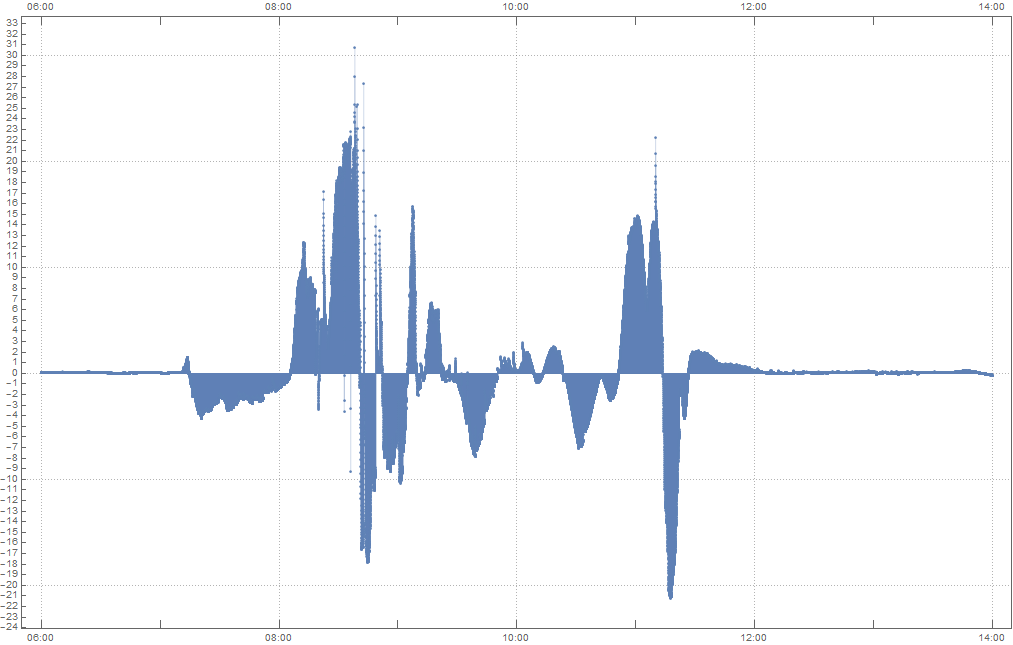
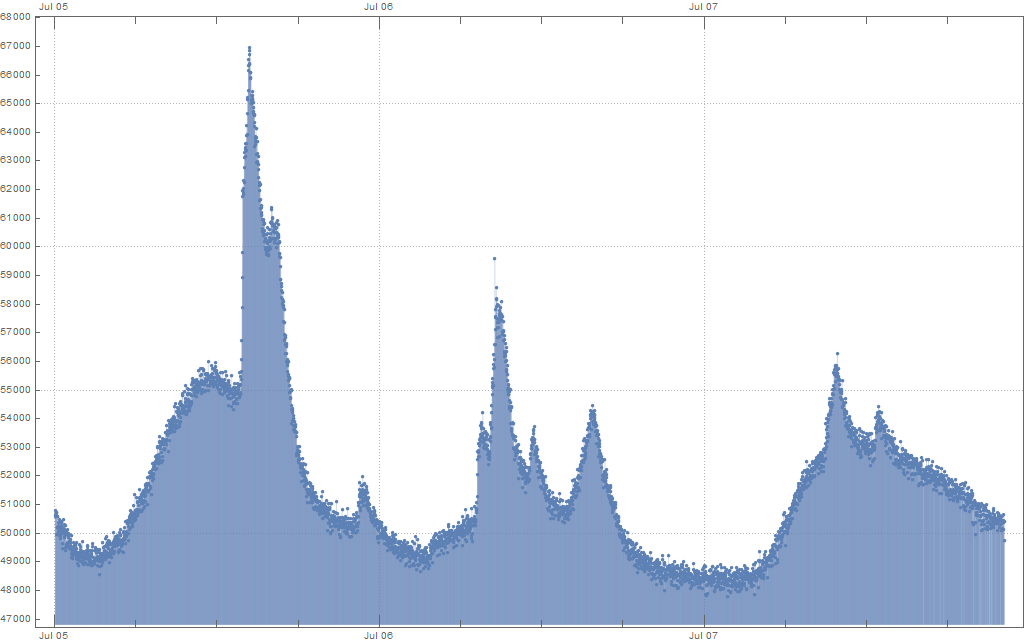
Generate the plot of unprocessed electric field:
plotOriginal[data_, rangeMin_, rangeMax_, rangeStep_] := DateListPlot[
    data,
    Filling->Axis,
    PlotRange->plottingRange,
    Joined->False,
    PlotTheme->"Detailed",
    FrameTicks->{{Range[rangeMin, rangeMax, rangeStep],None},All}
]

plotEField = plotOriginal[electricField, -50, 50, 1]
plotNaI3 = plotOriginal[naI3, 30000, 70000, 1000]
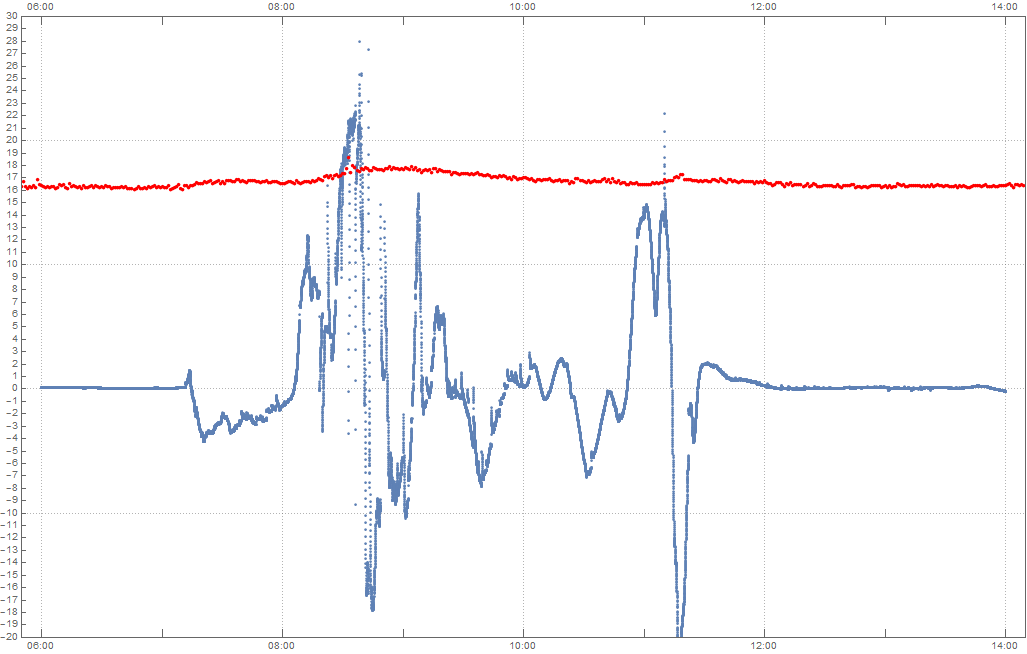
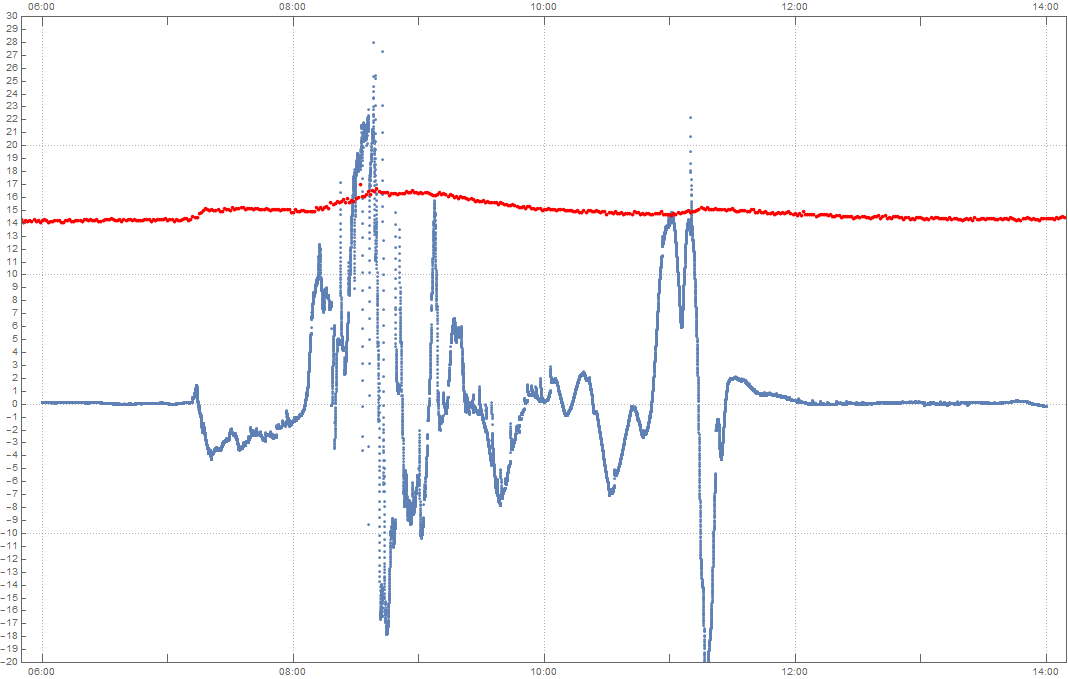
Show[DateListPlot[electricField, PlotRange -> {-20, 30},
  Joined -> False, PlotTheme -> "Detailed",
    FrameTicks -> {{Range[-50, 50, 1], None}, All}],
 DateListPlot[stand1Normalized, PlotRange -> Full, PlotStyle -> Red,
  Joined -> False]]
Get local minima and maxima in time series
getMaxs[detectorData_, sigma_, sharpness_, triggerShreshold_] := DeleteCases[
Pick[
detectorData,
PeakDetect[
detectorData[[All, 2]],
sigma,
sharpness
],
1
],
{date_,data_}/;data >= triggerShreshold
];
getMaxs[detectorData_, sigma_, sharpness_] := Pick[
detectorData,
PeakDetect[
detectorData[[All, 2]],
sigma,
sharpness
],
1
];
getMins[detectorData_, sigma_, sharpness_, triggerShreshold_] := DeleteCases[
Pick[
detectorData,
PeakDetect[
-detectorData[[All, 2]],
sigma,
sharpness
],
1
],
{date_,data_}/;data >= triggerShreshold
];
getMins[detectorData_, sigma_, sharpness_] := Pick[
detectorData,
PeakDetect[
-detectorData[[All, 2]],
sigma,
sharpness
],
1
];
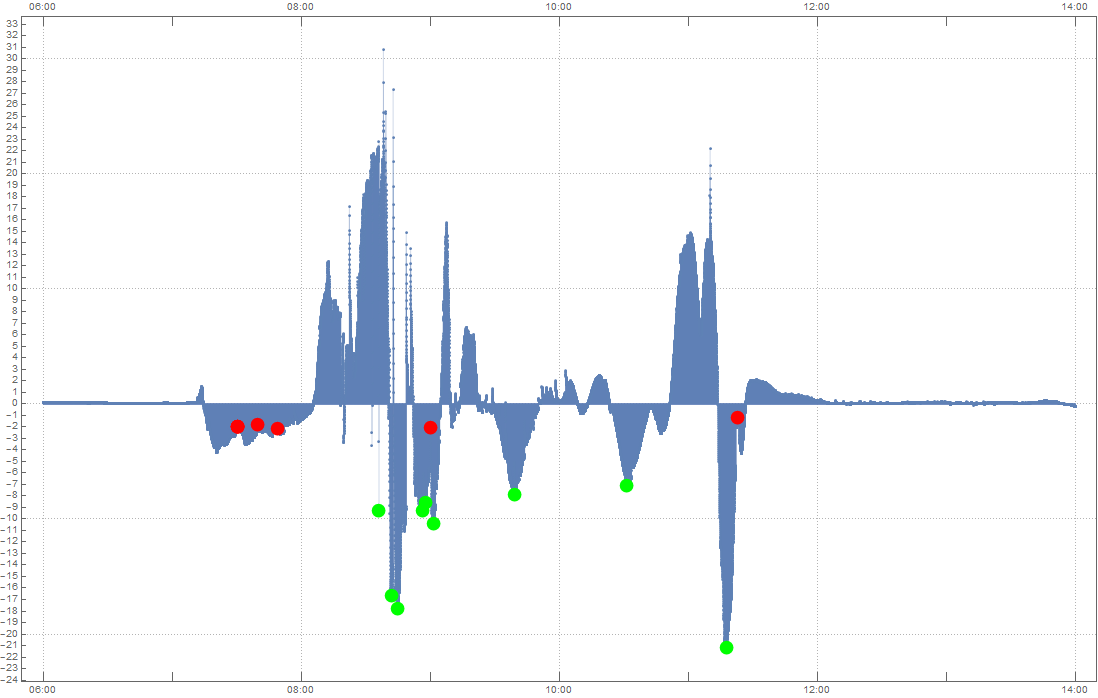
eFieldMins = getMins[electricField, 30, 0, -7]
eFieldMaxs = getMaxs[electricField, 50, 0, -0.5]
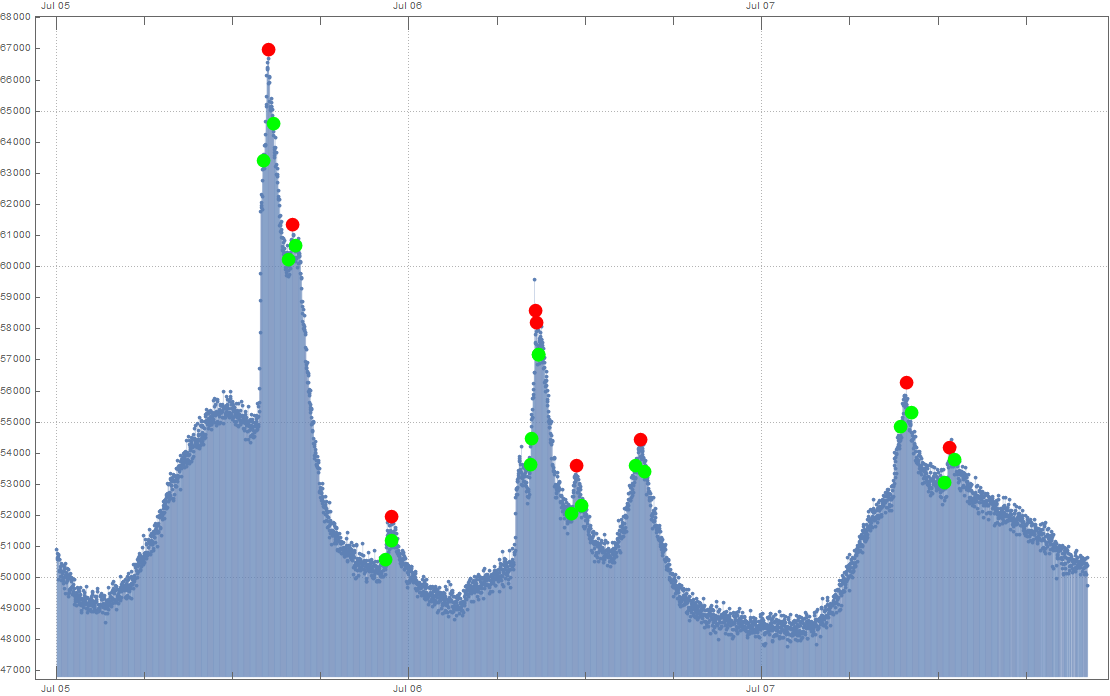
naI3Mins = getMins[naI3, 50, 0.3]
naI3Maxs = getMaxs[naI3, 15, 1.3]
Construct a graph of a data with minimas and maximas.
Show[
    plotNaI3,
    DateListPlot[
     naI3Maxs,
     PlotStyle -> Red,
     PlotRange -> naI3PlottingRange,
     Joined -> False
    ],
    DateListPlot[
     naI3Mins,
     PlotStyle -> Green,
     PlotRange -> naI3PlottingRange,
     Joined -> False
    ]
 ]

Show[
    plotEField,
    DateListPlot[
       eFieldMaxs,
       PlotStyle->Red,
       PlotRange->eFieldPlottingRange,
       Joined->False
    ],
    DateListPlot[
       eFieldMins,
       PlotStyle->Green,
       PlotRange->eFieldPlottingRange,
       Joined->False
    ]
]
Find the start and end of the peaks
eFieldRightEdges = (rightEdge[electricField, eFieldPeakPositions, #,
      1200, 30, 0]) & /@ Range[1, Length[eFieldPeakPositions]];
eFieldLeftEdges = (leftEdge[electricField, eFieldPeakPositions, #,
      1200, 30, 0]) & /@ Range[1, Length[eFieldPeakPositions]];

naI3RightEdges = (rightEdge[naI3, naI3PeakPositions, #, 21, 1]) & /@
   Range[1, Length[naI3PeakPositions]];
naI3LeftEdges = (leftEdge[naI3, naI3PeakPositions, #, 21, 1]) & /@
   Range[1, Length[naI3PeakPositions]];

 Attachments:


