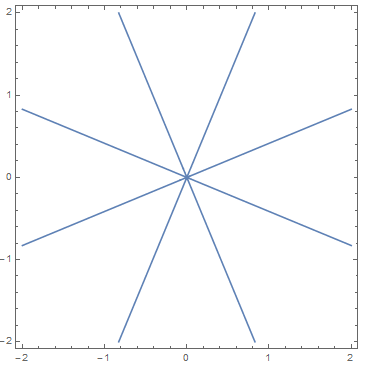
Group Abstract Group Abstract

Message Boards Message Boards

Plot this result from Reduce?

In[8]:=  res = 
     Reduce[(x1 + I x2)^4 + (x2 + I x1)^4 == 0 && Im[x1] == 0 && 
       Im[x2] == 0, {x1, x2}]

Out[8]= (x1 < 
    0 && (x2 == -Sqrt[3 x1^2 + 2 Sqrt[2] Sqrt[x1^4]] || 
     x2 == -Sqrt[3 x1^2 - 2 Sqrt[2] Sqrt[x1^4]] || 
     x2 == Sqrt[3 x1^2 - 2 Sqrt[2] Sqrt[x1^4]] || 
     x2 == Sqrt[3 x1^2 + 2 Sqrt[2] Sqrt[x1^4]])) || (x1 == 0 && 
   x2 == 0) || (x1 > 
    0 && (x2 == -Sqrt[3 x1^2 + 2 Sqrt[2] Sqrt[x1^4]] || 
     x2 == -Sqrt[3 x1^2 - 2 Sqrt[2] Sqrt[x1^4]] || 
     x2 == Sqrt[3 x1^2 - 2 Sqrt[2] Sqrt[x1^4]] || 
     x2 == Sqrt[3 x1^2 + 2 Sqrt[2] Sqrt[x1^4]]))
POSTED BY: Frank Kampas
7 Replies
Graph of y^2 = x((x^2)-1) with x and y complex 

In[1]:= eqns = y^2 - x (x^2 - 1) == 0 /. {x -> x1 + I x2, y -> y1 + I y2} // 
  ComplexExpand

Out[1]= x1 - x1^3 + 3 x1 x2^2 + y1^2 - y2^2 + I (x2 - 3 x1^2 x2 + x2^3 + 2 y1 y2) == 0

In[2]:= eqre = x1 - x1^3 + 3 x1 x2^2 + y1^2 - y2^2 == 0;
eqim = x2 - 3 x1^2 x2 + x2^3 + 2 y1 y2 == 0;

 Imaginary part of x = 0

In[5]:= Show[DiscretizeRegion[
  ImplicitRegion[(eqre && eqim) /. 
    x2 -> 0, {{x1, -3, 3}, {y1, -3, 3}, {y2, -3, 3}}], 
  MaxCellMeasure -> 10^-3], Boxed -> True, Axes -> True, ImageSize -> Medium]

enter image description here

POSTED BY: Frank Kampas

ImplicitRegion look promising

In[14]:= res = 
 Reduce[(x1 + I x2)^4 + (x2 + I x1)^4 == 0 && Im[x1] == 0 && 
   Im[x2] == 0, {x1, x2}]

Out[14]= (x1 < 
    0 && (x2 == -Sqrt[3 x1^2 + 2 Sqrt[2] Sqrt[x1^4]] || 
     x2 == -Sqrt[3 x1^2 - 2 Sqrt[2] Sqrt[x1^4]] || 
     x2 == Sqrt[3 x1^2 - 2 Sqrt[2] Sqrt[x1^4]] || 
     x2 == Sqrt[3 x1^2 + 2 Sqrt[2] Sqrt[x1^4]])) || (x1 == 0 && 
   x2 == 0) || (x1 > 
    0 && (x2 == -Sqrt[3 x1^2 + 2 Sqrt[2] Sqrt[x1^4]] || 
     x2 == -Sqrt[3 x1^2 - 2 Sqrt[2] Sqrt[x1^4]] || 
     x2 == Sqrt[3 x1^2 - 2 Sqrt[2] Sqrt[x1^4]] || 
     x2 == Sqrt[3 x1^2 + 2 Sqrt[2] Sqrt[x1^4]]))

In[15]:= RegionPlot[ImplicitRegion[res, {x1, x2}]]

enter image description here

POSTED BY: Frank Kampas

No idea RegionPlot could also do 1D regions (lines)!

POSTED BY: Sander Huisman

I think it only does that for an ImplicitRegion

POSTED BY: Frank Kampas

x1 and x2 are real?

You can plug in the equation immediately:

ContourPlot[{(x1 + I x2)^4 + (x2 + I x1)^4 == 0}, {x1, -100, 100}, {x2, -100, 100}]

For other kinds of plots, you might want to look at the function ToRules, or if it is region that satisfies the equation (bigger/smaller than something) you can use RegionPlot...

POSTED BY: Sander Huisman

Best way is:

ContourPlot[(x1 + I x2)^4 + (x2 + I x1)^4 == 0, {x1, -2, 2}, {x2, -2, 2}, MaxRecursion -> 4]
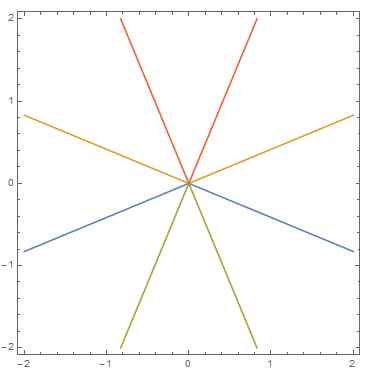
enter image description here

Or manualy:

  sol = LogicalExpand[Reduce[(x1 + I x2)^4 + (x2 + I x1)^4 == 0 && Im[x1] == 0 && Im[x2] == 0, {x1, x2}]]
  p1 = ContourPlot[Evaluate[{sol[[2, 1]], sol[[4, 1]], sol[[6, 1]], sol[[8, 1]]}], {x1, -2, 2}, {x2, -2, 2}, MaxRecursion -> 4, 
          RegionFunction -> Function[{x1, x2}, x1 > 0]]
  p2 = ContourPlot[Evaluate[{sol[[3, 1]], sol[[5, 1]], sol[[7, 1]], sol[[9, 1]]}], {x1, -2, 2}, {x2, -2, 2}, MaxRecursion -> 4, 
          RegionFunction -> Function[{x1, x2}, x1 < 0]]
  Show[{p1, p2}]

enter image description here

POSTED BY: Mariusz Iwaniuk

I was hoping for a general method.

POSTED BY: Frank Kampas
Reply to this discussion
Community posts can be styled and formatted using the Markdown syntax.
Reply Preview
Attachments
Remove
or Discard