Group Abstract Group Abstract

Message Boards Message Boards

Plot line intersections in 3D?

Posted 9 years ago

I have spent the last hour trying to figure out how to plot a line in 3D in either WolframAlpha or Mathematica. I am not experienced with either of these products, but I should not be having such a hard time trying to perform such a simple task. Ultimately I would like to check if two lines intersect in 3D, but I do not know how to properly represent the equations to these lines so that they are plotted as vectors in 3D.

Any help would be much appreciated,

POSTED BY: Alex Gausman
5 Replies
Posted 9 years ago
POSTED BY: Alex Gausman
Posted 9 years ago

Here is another approach. Lines are defined by vector equations. The vector equation for each line is derived from a pair of points on the line, but they are just two points on the line -- it is not a line segment with endpoints. We then have two lines, each parameterized by its own parameter. FindInstance is used to determine a pair of parameter values for which the lines share a common point. If no intersection exists, it will return an empty list.

(* a vector equation for a line from two points *)

pa1 = {-2, -3, -1}; pa2 = {3, 2, 2};

lineA[t_] := pa1 + t Normalize[pa2 - pa1]

(* a second line *)

(* notice they intersect at {3,2,2} *)

pb1 = {-4, 1, -3}; pb2 = {3, 2, 2};

lineB[t_] := pb1 + t Normalize[pb2 - pb1]

(* find an intersection *)
(* if they don't intersect, FindInstance would return { } *)

intersection = FindInstance[lineA[t1] == lineB[t2], {t1, t2}]

{{t1 -> Sqrt[59], t2 -> 5 Sqrt[3]}}

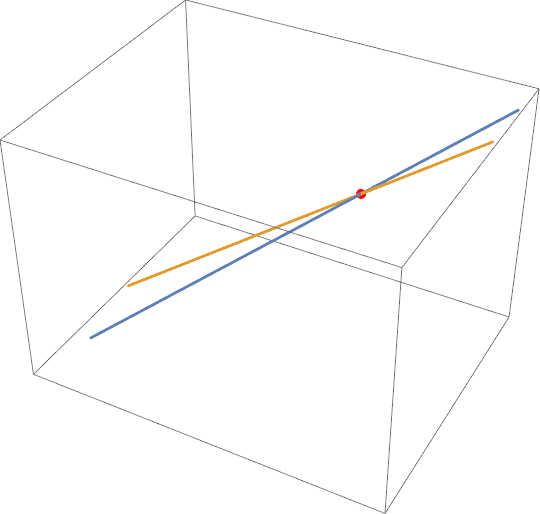
Show[Graphics3D[{PointSize[Large], Red, 
   Point[lineA[t1] /. intersection[[1]]]}], 
 ParametricPlot3D[{lineA[t], lineB[t]}, {t, -5, 15}]]

enter image description here

POSTED BY: David Keith

Maybe like this:

p1 = {-1, 0, 0};  (*This defines point no.1*)
p2 = {1, 1, 1}; (*This defines point no.2*)
p3 = {-1, 1, 1};  (*This defines point no.3*)
p4 = {0, 0, 0}; (*This defines point no.4*)

  Show[Plot3D[0, {x, -1, 1}, {y, -1, 1}, PlotStyle -> None, 
  Mesh -> None, RegionFunction -> Function[{x}, 0 < x < 0], 
  AxesLabel -> Automatic], 
  Graphics3D[{{Blue, Thick, Line[{p1, p2}]}, {Green, Thick, Line[{p3, p4}]}}]]

enter image description here

POSTED BY: Mariusz Iwaniuk
Posted 9 years ago

A slightly more simple variation?

p1 = {-1, 0, 0}; (*This defines point no.1*)
p2 = {1, 1, 1}; (*This defines point no.2*)
p3 = {-1, 1, 1}; (*This defines point no.3*)
p4 = {0, 0, 0}; (*This defines point no.4*)
Graphics3D[{
    Thick,
    Blue,
    Line[{p1, p2}],
    Green,
    Line[{p3, p4}]
  }, Axes -> True
]

enter image description here

POSTED BY: Hans Milton

You could define the lines in term of endpoints and use the method described in

https://reference.wolfram.com/language/ref/Line.html

POSTED BY: Frank Kampas
Reply to this discussion
Community posts can be styled and formatted using the Markdown syntax.
Reply Preview
Attachments
Remove
or Discard