Group Abstract Group Abstract

Message Boards Message Boards

Get a better resolution of the intersection of two surfaces?

Posted 9 years ago

I want to get a more precise graphic of the intersection curve of two surfaces. How can I add more points to the graphic, so that it looks more preciseIntersection of two surfaces?

ContourPlot3D[{y^2 - x^2 - x^3 + 0 z == 0, y - x*z == 0}, {x, -2, 
  2}, {y, -2, 2}, {z, -2, 2}, 
 MeshFunctions -> {Function[{x, y, z, 
     f}, (y^2 - x^2 - x^3 + 0 z) - (y - x*z)]}, 
 MeshStyle -> {{Thick, Black}}, Mesh -> {{0}}, 
 ContourStyle -> 
  Directive[White, Opacity[0.5], Specularity[White, 30]]]
Attachments:
POSTED BY: Isabell Sch.
5 Replies
Posted 9 years ago

Thank you very much! I will try to get simpler surfaces.

POSTED BY: Isabell Sch.

That case is more complicated, but perhaps still manageable. I would start with Reduce:

Reduce[(x^2 y^2)^3 - x^4 + 2 x^2 y^2 - y^4 == 0, {x, y, z}, Reals]

One piece of your graph is like this:

ContourPlot3D[
 y == Sqrt[Root[-x^4 + 2 x^2 #1 - #1^2 + x^6 #1^3 &, 1]], {x, -5, 
  5}, {y, -5, 5}, {z, -5, 5}, 
 MeshFunctions -> {Function[{x, y, z, f}, -(y - x z)]}, 
 MeshStyle -> {{Thick, Black}}, Mesh -> {{0}}, 
 ContourStyle -> 
  Directive[White, Opacity[0.5], Specularity[White, 30]]]

There are a few more, obtained by changing the sign of the Sqrt and the number of the Root. I have not tried them all.

POSTED BY: Gianluca Gorni
Posted 9 years ago

Is it also possible to do it for some more complicated surfaces, for example (x^2+y^2)^2+3x^2y-y^3)=0 and (x^2+y^2)^3-x^4+2x^2y^2-y^4=0? I also would like to have the intersection of these surfaces with the surface y_x*z=0. I don't know how to split them into nicer-behaved surfaces. My result for the second surface is

ContourPlot3D[{(x^2*y^2)^3 - x^4 + 2 x^2*y^2 - y^4 == 0, 
y - x*z == 0}, {x, -5, 5}, {y, -5, 5}, {z, -5, 5}, 
MeshFunctions -> {Function[{x, y, z, 
f}, ((x^2*y^2)^3 - x^4 + 2 x^2*y^2 - y^4) - (y - x*z)]}, 
MeshStyle -> {{Thick, Black}}, Mesh -> {{0}}, 
ContourStyle -> 
Directive[White, Opacity[0.5], Specularity[White, 30]]]

and you can't recognize anything in the graphic Intersection

I would be glad, if someone could help me! Thank you.

POSTED BY: Isabell Sch.
Posted 9 years ago

Dear Gianluca Gorni, thank you very much for your answer! That is exactly the graphic I wanted to get! Greetings, Isabell

POSTED BY: Isabell Sch.

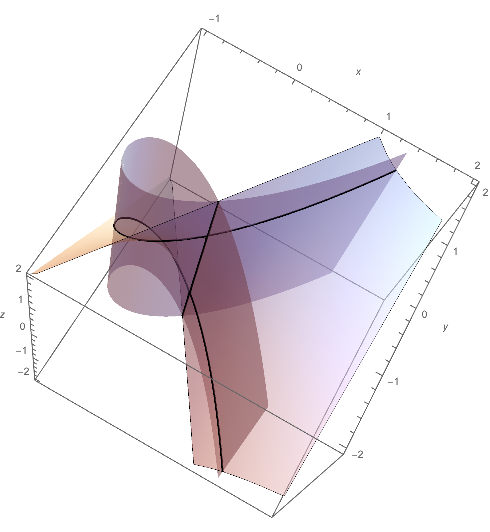
Along the z axix the function y^2 - x^2 - x^3 + 0 z has zero gradient, and this makes it difficult to compute the mesh numerically. You get a better picture by splitting the surface into two nicer-behaved surfaces:

Show[ContourPlot3D[{y == x Sqrt[1 + x], y == -x Sqrt[1 + x]}, {x, -1, 
   2}, {y, -2, 2}, {z, -2, 2}, 
  MeshFunctions -> {Function[{x, y, z, f}, -(y - x*z)]}, 
  MeshStyle -> {{Thick, Black}}, Mesh -> {{0}}, 
  ContourStyle -> 
   Directive[White, Opacity[0.5], Specularity[White, 30]], 
  AxesLabel -> Automatic, BoundaryStyle -> None],
 ContourPlot3D[y - x*z == 0, {x, -2, 2}, {y, -2, 2}, {z, -2, 2}, 
  Mesh -> None, 
  ContourStyle -> 
   Directive[White, Opacity[0.5], Specularity[White, 30]]]]

enter image description here

POSTED BY: Gianluca Gorni
Reply to this discussion
Community posts can be styled and formatted using the Markdown syntax.
Reply Preview
Attachments
Remove
or Discard