Hello,
I must be missing something very simple, or this is a bug in ContourPlot, at least in the option ColorFunction:
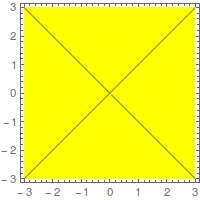
ContourPlot[x^2 - y^2, {x, -3, 3}, {y, -3, 3}, Contours -> {0}, ColorFunction -> (If[#1 < 0, Red, Yellow] &), ImageSize -> 200]
I tried slightly different functions inside the ColorFunction. Basically I compare #1 to zero using <, >, <=, >=, and == (#1 < 0 &, #1 <= 0 &, etc.). Three of the five look wrong to me. I tried increasing PlotPoints, changed all the "0" to "0.0". Nothing helped. The use of ColorFunction is copied straight from the documentation of ContourPlot (last example under Options > ColorFunction):
Make everything red above a contour at z==1/2:
ContourPlot[Cos[x] + Cos[y], {x, 0, 4 Pi}, {y, 0, 4 Pi}, Contours -> {1/2}, ColorFunction -> (If[#1 > 1/2, Red, White] &)]
I am using Mathematica 11.0.0.0, Student Edition. I hope I am wrong.
Thanks,
OL.


