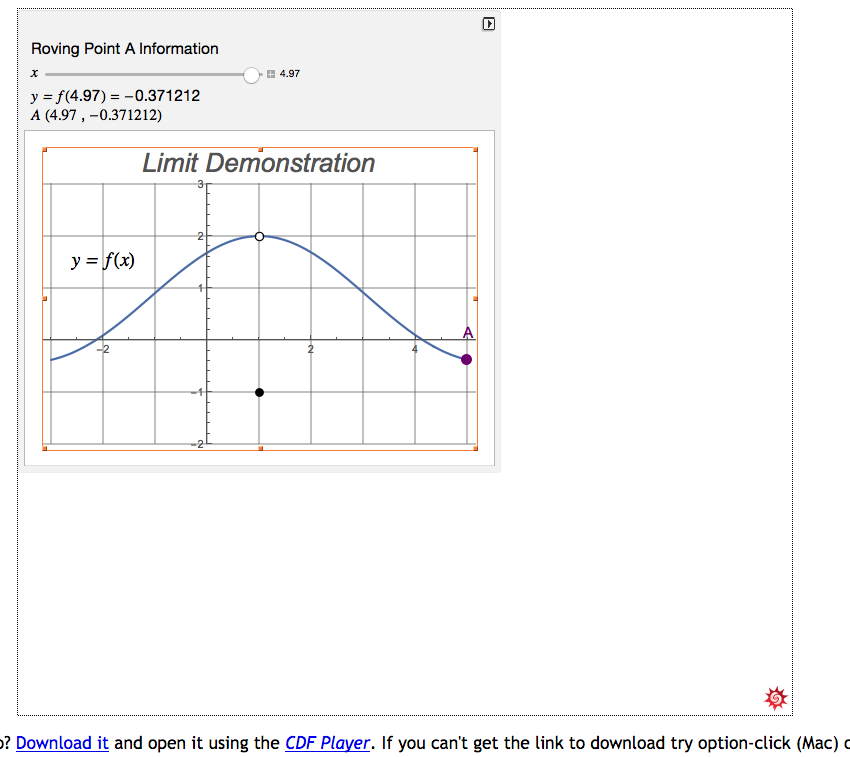
Hello, I am trying to embed the Manipulate display below into a webpage. When I export the selected code to cdf the display appears with a great deal of empty space padding the Manipulate display on the web page. Not sure why. Here is an image of the result: 
I am a new Mathematica user.
Thanks.
Manipulate[Show[
  Plot[g[x], {x, -3, 5}, PlotRange -> {-2, 3},
   GridLines -> {Range[-3, 5, 1], Range[-4, 6, 1]},
   AspectRatio -> Automatic,
   PlotLabel ->
    Style["Limit Demonstration", FontSize -> Large, Italic],
   PlotStyle -> Thick, ImageSize -> 400
   ], (* End PLOT *)
  Graphics[{White, Disk[{1, 2}, 0.06]}],
  Graphics[{Black,
    Circle[{1, 2}, 0.08], {PointSize[0.02], Point[{1, -1}]}}],
  Graphics[{Purple, PointSize[0.025], Point[{a, g[a]}]} ],
  Graphics[Text[Style["A", 14, Purple], {a + .05, g[a] + 0.5}]],
  Graphics[
   Text[Style["y = f(x)", 18, FontFamily -> Times, Italic], {-2, 1.5}]]
  ],(* End SHOW *)
 Item[""],
 Item[Style["Roving Point A Information", 14]],
 {{a, 0, Style["x", 14, Italic, FontFamily -> Times]}, -3, 5, 0.01,
  Appearance -> "Labeled"},
 Dynamic[Row[{Style["y = f(", Italic, FontFamily -> Times,
     FontSize -> 14],  Style[a, FontSize -> 14],
    Style[") = ", FontSize -> 14, FontFamily -> Times],
    Style[g[a], FontSize -> 14]}]],
 Dynamic[Row[{Style["A (", Italic, FontFamily -> Times,
     FontSize -> 14],  Style[a, FontSize -> 14, FontFamily -> Times],
    Style[" , ", 14],
    Style[g[a], FontSize -> 14, FontFamily -> Times],
    Style[")", FontSize -> 14, FontFamily -> Times]}]],
 Initialization :> (g[x_] :=
    Piecewise[{{2 Sin[x - 1]/(x - 1), x != 1}, {-1, x == 1}}])
 ]  (* End MANIPULATE *)