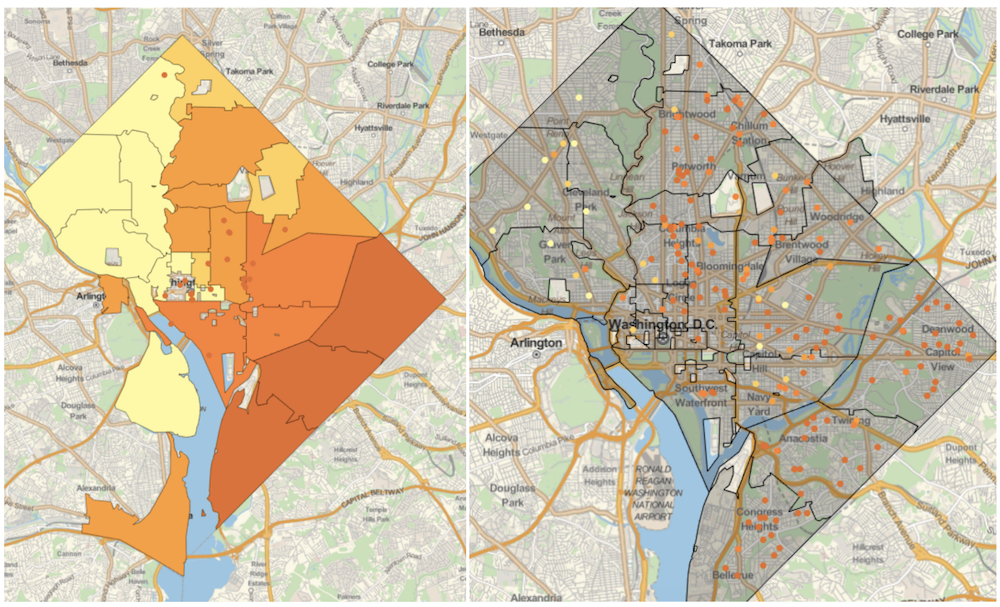
Introduction
Since early September, I have been fortunate to participate in the Opportunity Project, an open data effort run by the White House which put data and tools in the hands of civic leaders, community organizations, and families to help them navigate information about critical resources such as access to jobs, housing, transportation, schools, and other neighborhood amenities. My contribution to the project was a tool that helps community leaders find summer meal sites for students in need who usually get a free or reduced price lunch but do not have an alternative during the summer in Washington, D.C.
In this post I will discuss how I worked through this project, which has been divided into these two sections:
I. Data
II. The Tool
All code was written in Mathematica using the Wolfram Language.
I. Importing Data
My data was retrieved from the Wolfram Data Repository, a curated cloud repository of computable data resources, all set up to be instantly usable in the Wolfram Language. The Data Repository includes a growing number of numerical, textual, image, and other data resources from a very wide range of application areas.
I used the ResourceSearch to search the repository for data related to summer meal sites.
ResourceSearch["USDA"]
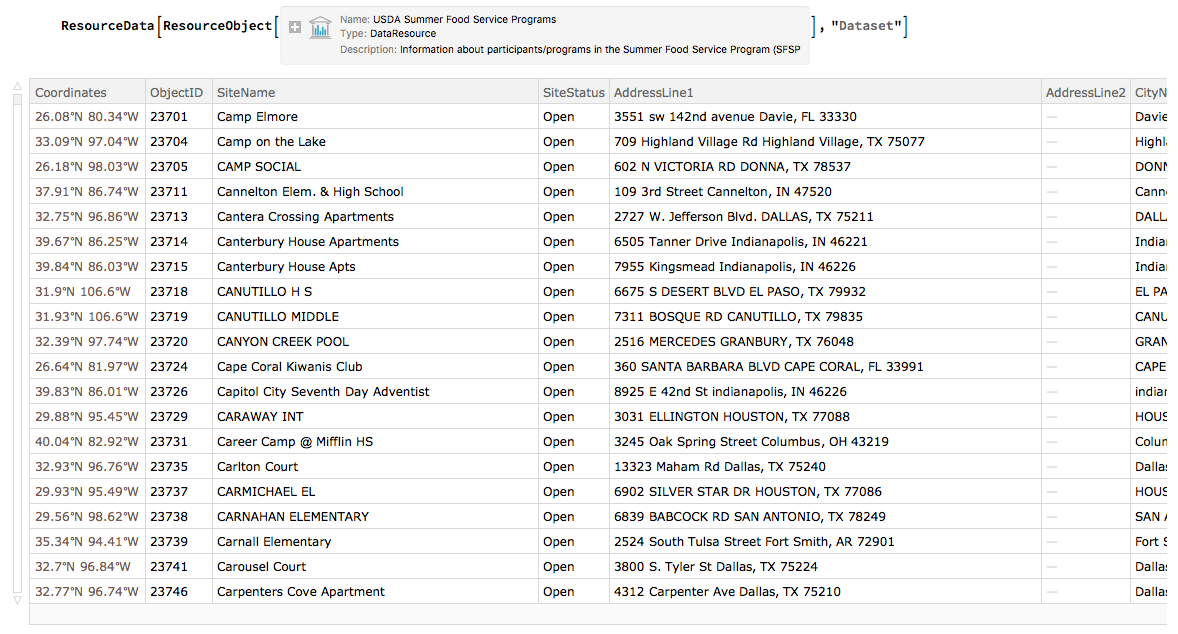
For this project, I used the data on the SFSP (Summer Food Service Program) program.

Using the ResourceData extracts the dataset of the ResourceObject into something usable.
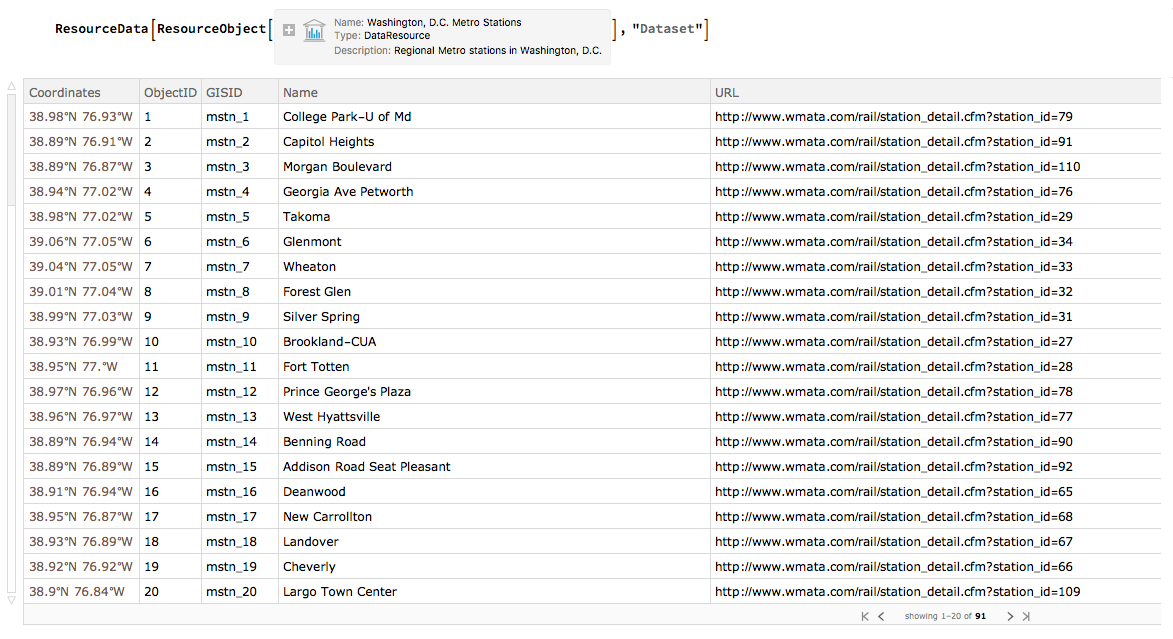
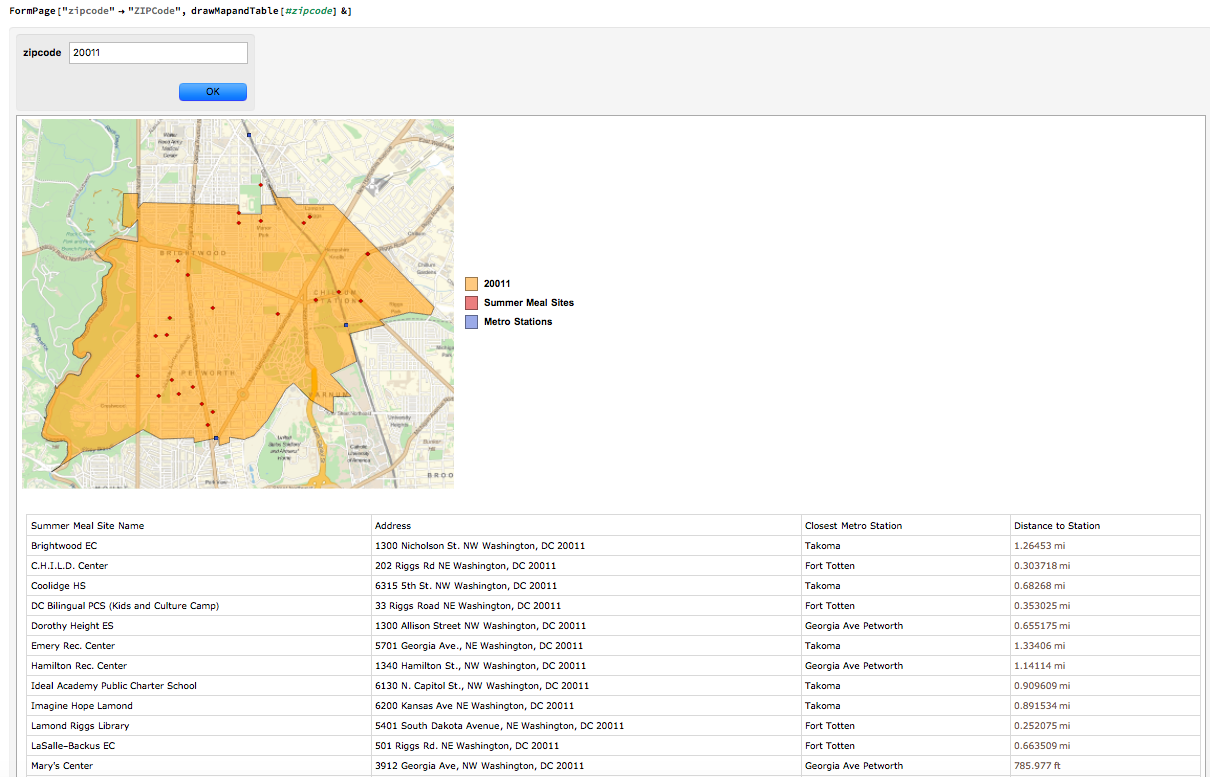
As an additional feature, the tool also displays the nearest metro stations to the summer meal sites in the searched zip code.

In my tool, I weave this data together so that I can create a complete picture of an area.

II. The Tool
There are two parts to this tool - finding zip codes with the most need, and identifying meal sites within a zip code (or on the flip side, where there isn't one).
Identifying Areas with the Most Need
Much of the data I used to identify the areas with the most need for summer meal sites was from Wolfram Alpha data built into the Wolfram Language. One example of the data I used is the percentage of school aged children who live under the poverty line, which can be found like this:

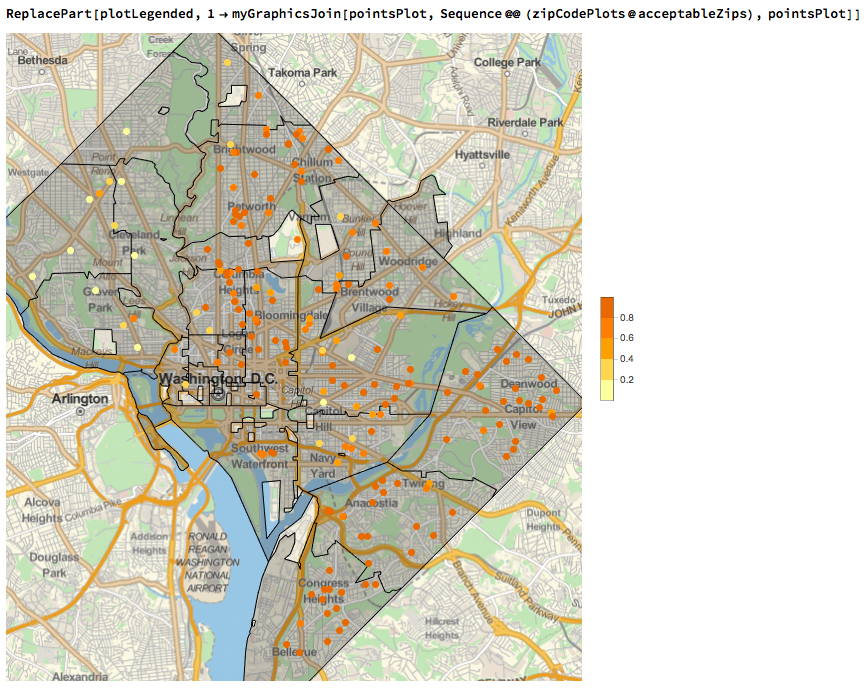
I used this demographical data to create heat maps with GeoRegionValuePlot.
Identifying Zip Codes with the Most Students Under the Poverty Line

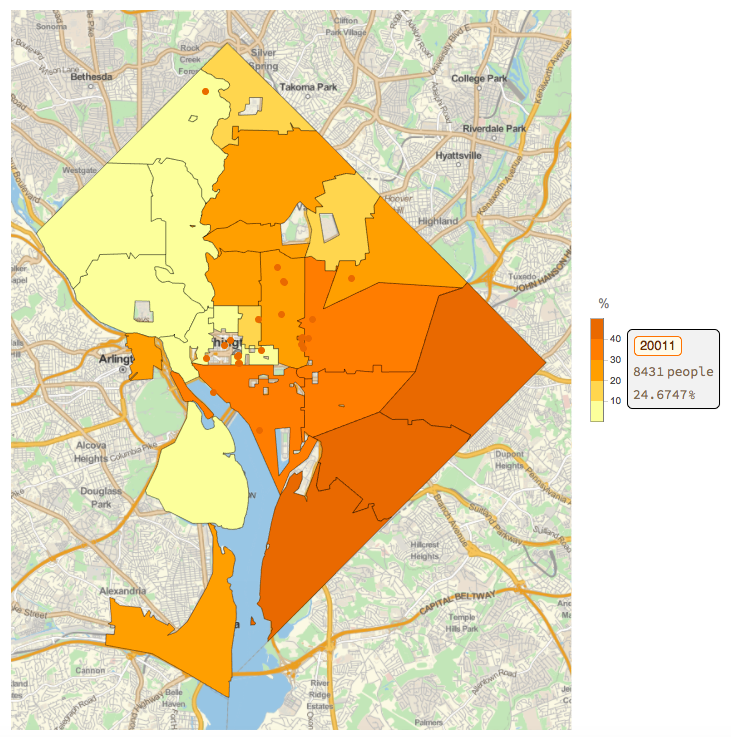
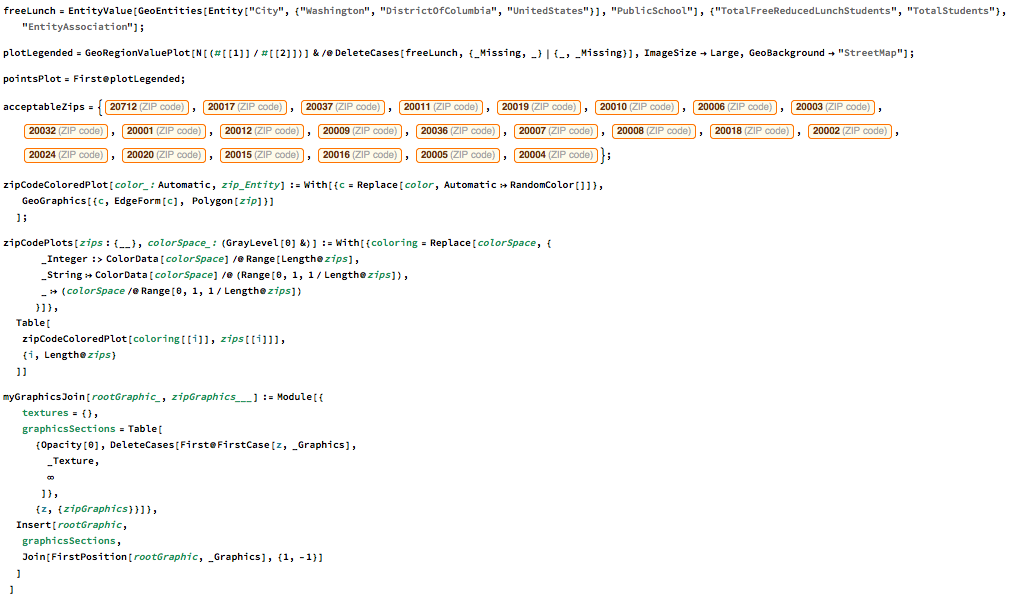
Identifying Schools with the Most Students who Receive Free or Reduced Price Lunch
Zeroing in on a Zip Code
Finding Summer Meal Sites
The SFSP data includes the zip code of each summer meal site, so I used this to filter all summer meal sites in a certain zip code.

Finding Nearby Metro Stations
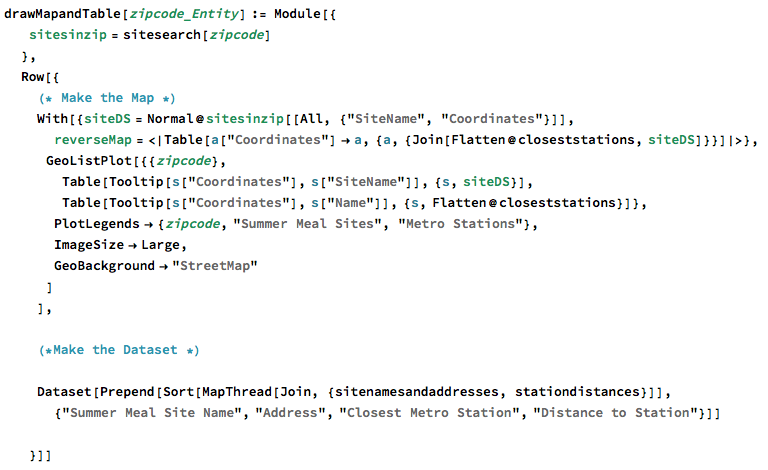
We can use the Wolfram Language's built in functions for geo computations to find the nearest metro stations to the meal sites.

Putting it All Together
Conclusion
Future Steps
In order to make the tool usable by the general public, I will be cloud deploying the tool so that it can be easily accessible over the web. I also plan to add bus stops to the transportation options shown in the tool.
It has been a great experience for me to be a part of such a large project. It's exciting to see that the tool has the potential to help people. I've learned a lot from this project and hope to continue looking into what the Wolfram Language can do with data.
 Attachments: