This is just to announce the availability of SetAxes, a free package for formatting axes, for 2-D plots, in the traditional (journal) style. SetAxes contains some very simple, but useful, convenience functions which avoid any low-level programming. The package and its documentation, plus a few examples, are available at
http://causascientia.org/math_stat/SetAxes.html
Comments welcome.
Overview
The plotting capabilities of Mathematica are truly impressive but axes in these plots are designed, by default, to be generic so that they will work for many different kinds of plots. The traditional style of axes on 2-D plots seen in scientific journals is rather different. Tick marks, for instance, are typically drawn outside the plot area, not inside. The Mathematica language is very powerful and alternate formatting of plots can be achieved by the user, to any reasonable specification, but not without some detailed, low-level programming which may not be completely familiar.
The SetAxes package was written to make available a few simple convenience functions with which one can specify the tick marks and labelling of an axis in a 2-D plot. Although, as programming, they are fairly trivial, I have found the package extremely useful and decided that it was probably worth sharing.
Package functionality is described below with output for three examples.
Functions
SetAxes provides three functions: setLinAxis[], setLogAxis[] and defaultAxes[], wth arguments as follows:
setLinAxis[
    isAbscissa (True/False)
    axis label
    lower bound
    upper bound
    # of major ticks, including ends
    # of minor ticks between major ticks
    {# of digits in tick label, # of decimal places in the latter}]

setLogAxis[
    isAbscissa (True/False)
    axis label
    lower bound ((int) log10)
    upper bound ((int) log10)
    # of minor ticks between major ticks (0, 1, 4 or 8)]

defaultAxes[]
    Restore both axes to their default format
Examples
The following plots are meant to be illustrative, not comprehensive. There are many more possibilities (see documentation). These plots were exported, as PNG files, with width = 400 pts but are here resized to 600 pts. Note: PDF files have much better resolution but are not fully compatible with all web browsers.
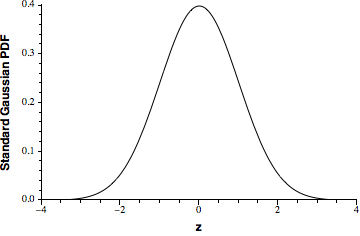
Two linear axes
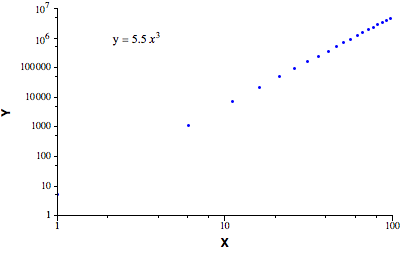
Log-Log plot
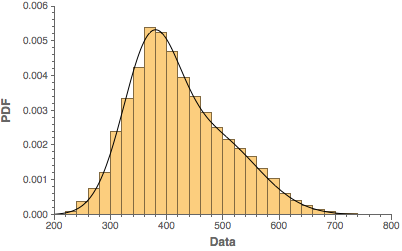
Smooth histogram superimposed on histogram
Documentation
The SetAxes documentation consists of one Mathematica notebook illustrating various uses of the package. A comment at the top of the notebook provides installation instructions.


