Hello, everyone. I am working on my homework and having a problem here. I have an equation and with different values of b, I can have different equations. I drew the figure but I don't know how to add b values to stand for each curve.
Code:
\[Mu] = 50*10^9;
b = {0.242*10^-9, 0.1*10^-9, 0.2*10^-9, 0.3*10^-9, 0.4*10^-9, 0.5*10^-9, 0.155*10^-9};
LogLogPlot[\[Mu]*b^2*Log[4*(1/2*Sqrt[\[Rho]])/b]/(4*\[Pi]), {\[Rho], 10^6, 10^20}, PlotRange -> {{10^6, 10^20}, All}, AspectRatio -> 1,
Frame -> True, PlotStyle -> Thick]
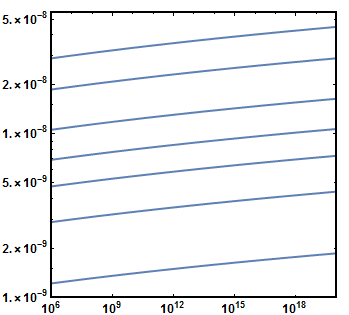
I tried PlotLegends->{"b=0.1x10^-9"....} and /.b->{0.1x10^-9,0.155x10^-9......}, both didn't work.
I want to know how I can show different b values to represent different curves and how do I gain different colors or line styles.
Please help me out here. Thank you.


