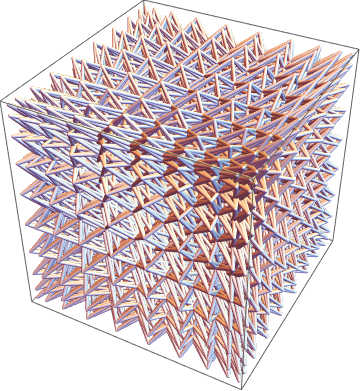
This is the structure when n is 20. Below you can find more about how I created it.
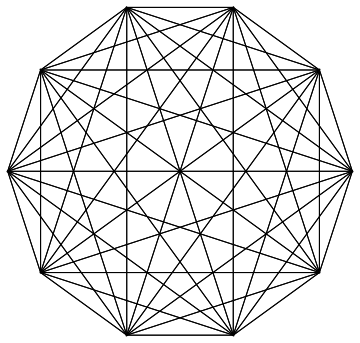
Here is the graphic generated with 2 tuples showing every combination between 2 points on a circle.
Graphics[{EdgeForm[Thick], Line /@ Tuples[N@CirclePoints[10], 2]}]
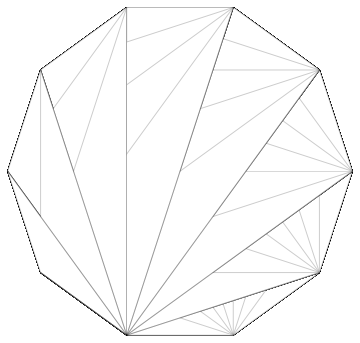
Then when showing every possible combination of trios using triangles, it has the same structure.
Graphics[{White, EdgeForm[Thin], Triangle /@ Tuples[N@CirclePoints[10], 3]}]
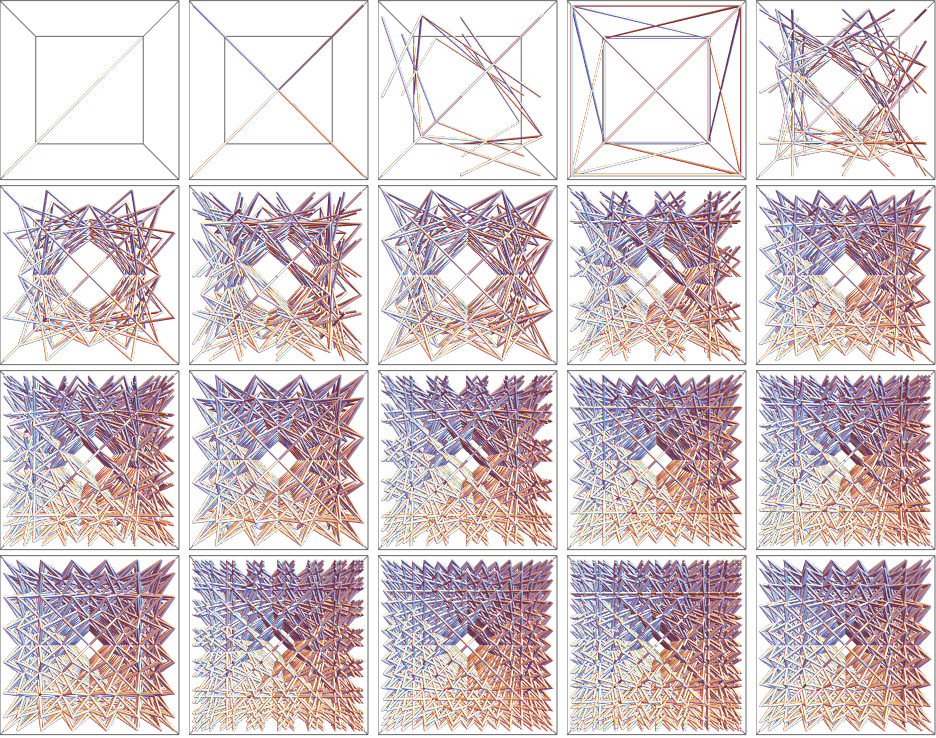
It get's interesting though, when we transpose those 3 tuples of 2D coordinates into pairs of 3 dimensional coordinates. They all resemble cubes.
Grid[Partition[Table[Graphics3D[{Tube[Transpose /@ Tuples[N@CirclePoints[n], 3]]}, ViewPoint -> Front], {n, 1, 20}], 5]]
I currently am looking into the structure more to try and find patterns. I first thought that I would take a look into patterns in its graph theory, which is yielding some interesting combinations of graphs.
Grid@Partition[Table[Graph[#[[1]] -> #[[2]] & /@ (Transpose /@ Tuples[CirclePoints[n], 3])], {n, 1, 12, 1}], 4]
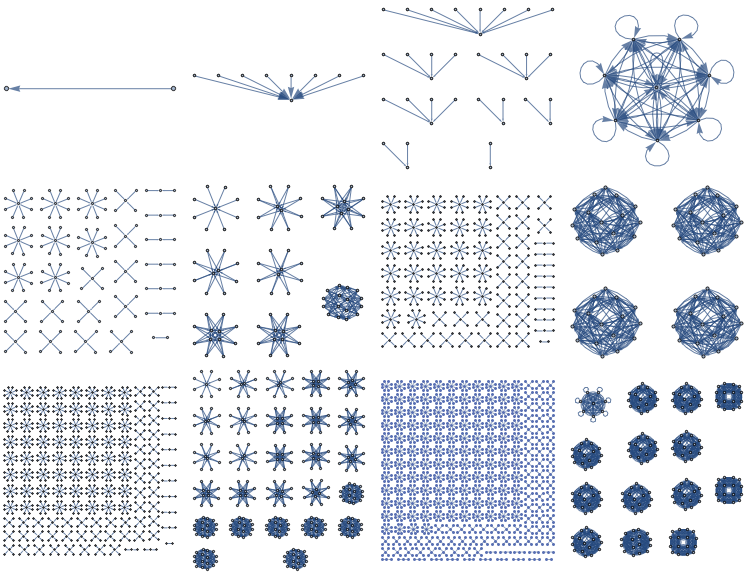
I've been looking into this structure and searching online for other people who have talked about it, but can't find anything about it online so I'm assuming I'm the first one to look into it. I'm now trying to learn more about its patterns and why it gives such cool looking cube like structures. Any thoughts or ideas about these structures would be appreciated.