Group Abstract Group Abstract

Message Boards Message Boards

Plot Iso-probability lines for Gaussian Processes?

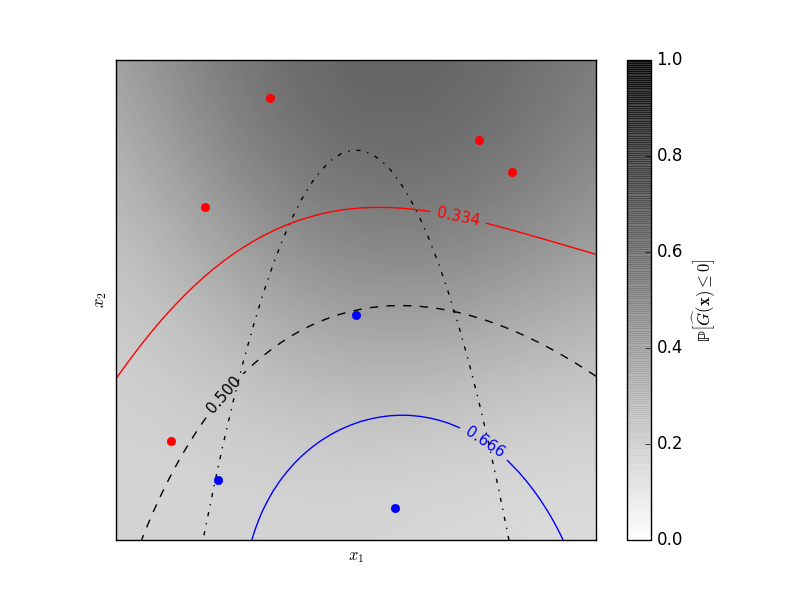
Hi, I have a question about plotting Iso-probability lines for Gaussian Processes classification in Mathematica. For example following figure shows a two-dimensional classification iso-probability lines for the predicted probabilities. Any advice is appreciated. enter image description here

POSTED BY: M.A. Ghorbani
2 Replies

Hi Sander, Many thanks for your help and attention. Ghorbani

POSTED BY: M.A. Ghorbani

Use ListDensityPlot or DensityPlot to create the 'background'. The lines can be created using ContourPlot (or regular Plot depending on the equations governing the lines). The plots can be combined using Show.

POSTED BY: Sander Huisman
Reply to this discussion
Community posts can be styled and formatted using the Markdown syntax.
Reply Preview
Attachments
Remove
or Discard