This project was part of a Wolfram Mentorship Program.
The classification of human motions based on patterns and physical data is of great importance in developing areas such as robotics. Also, a function that recognizes a specific human motion can be an important addition to artificial intelligence and physiological monitoring systems. This project is about acquiring, curating and analyzing experimental data from certain actions such as walking, running and climbing stairs. The data taken with the help of an accelerometer needs to be turned into an acceptable input for the Classify function. Finally, the function can be updated with more data and classes to make it more efficient and whole.
Algorithms and procedures
The data for this project was acquired by programming an Arduino UNO microprocessor with a Raspberry Pi computer, using Wolfram Language. An accelerometer connected to the Arduino sent measurements each time it was called upon, and Mathematica in the Raspberry Pi collected and uploaded the data. The raw data had to be processed for it to be a good input for the classify function. First, it was transformed into an spectrogram (to analyze the frequency domain of the data). Then, the spectrogram's image was put through the IFData function which filters out some of the noise, and finally the images were converted into numerical data with the UpToMeasurements function (main function: ComponentMeasurements). This collection numerical data was put in a classify function under six different classes (standing, walking, running, jumping and waving).
*The IFData function and the UpToMeasurements functions were sent to me by Todd Rowland during the Mentorship. Both functions will be shown at the end of this post.
Example visualization
The following ListLinePlot is an extract from the jumping data
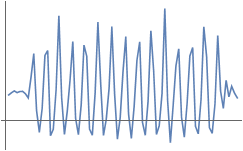
Next, the data from the plot above is turned into a spectrogram by the function Spectrogram, i.e.:
spectrogramImage =
 Spectrogram[jumpingData, SampleRate -> 10, FrameTicks -> None,
  Frame -> False, Ticks -> None, FrameLabel -> None]

Finally, all the spectrogram images are used as input for the UpToMeasurements function, along with some properties for the ComponentMeasurements function:
i.e:
numericalData =
 N@Flatten[
   UpToMeasurements[
    spectrogramImage, {"EnclosingComponentCount", "Max",
     "MaxIntensity", "TotalIntensity", "StandardDeviationIntensity",
     "ConvexCoverage", "Total", "Skew", "FilledCircularity",
     "MaxCentroidDistance", "ExteriorNeighborCount", "Area",
     "MinCentroidDistance", "FilledCount", "MeanIntensity",
     "StandardDeviation", "Energy", "Count", "MeanCentroidDistance"},
    1]]
Which outputs a list of real numbers, one for each of the properties:
{0., 1., 1., 1., 1., 19294.9, 0.222164, 0.985741, 31011.8, 15212.5, \
9624.42, -0.0596506, 0.724527, 190.534, 0., 42584.5, 0.364667, \
42584., 0.453101, 0.315209, 0.232859, 0.169549, 0.00909654, 42584., \
98.7136}
These numbers are grouped in a nested list which contains data for all 5 human motions. All the data is lastly classified in a classifier using the Classify function.
After several combinations of both properties and data sets, I was able to produce classifier functions with an accuracy of 91%, and a total size of 269kb.
Attempt on building a classify function using image processing
On the other hand, the image processing capabilities of Mathematica lets us extract data from images, hence it should be possible to create a classifier which recognizes the moving patterns in the frames of a video. First, I had to take the noise out of every image, this proved to be troublesome, since the background can vary greatly between video samples. Then, I binarized the image in order to isolate the moving particles in each frame, and extract their position with ImageData. Lastly, a data set can be formed from all the analyzed frames; this data can essentially be used in the same way as the accelerometer's, but the classifier was unsuccessful in separating the samples accurately. This was mainly because the accelerometer's data is taken at a constant rate and very precisely, whereas the images depend on the camera's frame rate, and many other external factors. This is what made the data different enough to fail being classified with accuracy. Furthermore, if a big dataset is made from videos of people performing certain actions, the data processing can follow similar steps as the ones explained in this report. Thus producing a similar classifier function. This can further increase the functions accuracy, but the process needs an algorithm that can effectively trace the path of "a particle" that moves through each of the frames of the video, and extract precise velocity data from said movement.
Conclusively, the classify function is working very well with the data provided, its accuracy is about 91% for the SupportVectorMachine method. This is a very good result for the human motion classifier. The next step is to add more classes to the function, and test the classifier with data acquired from different sources, such as another accelerometer and various videos of human motion footage.
Code:
UpToMeasurements function UpToMeasurements[image_,property_,n_]:=MaximalBy[ComponentMeasurements[image,"Count"],Last,UpTo[n]][[All,1]]/.ComponentMeasurements[image,property]
*Note: This function simplifies the exploration of properties to input in ComponentMeasurements, also, it outputs a usable list of numerical data retrieved from a given group of images.
IFData function: imagefunctions=<|1-> (EntropyFilter[#,3]&),
2-> (EdgeDetect[EntropyFilter[#,3]]&),
3->Identity,
4-> (ImageAlign[reference110,#]&),
5-> (ImageHistogram[#,FrameTicks->None,Frame->False,FrameLabel->None,Ticks->None]&),
6-> (ImageApply[#^.6&,#]&),
7-> (Colorize[MorphologicalComponents[#]]&),
8-> (HighlightImage[#,ImageCorners[#,1,.001,5]]&),
9-> (HighlightImage[#,Graphics[Disk[{200,200},200]]]&),
10-> ImageRotate,
11-> (ImageRotate[#,45Degree]&),
12->(ImageTransformation[#,Sqrt]&),
13->(ImageTransformation[#,Function[p,With[{C=150.,R=35.},{p[[1]]+(R*Cos[(p[[1]]-C)*360*2/R]/6),p[[2]]}]]]&),
14->( Dilation[#,DiskMatrix[4]]&),
15->( ImageSubtract[Dilation[#,1],#]&),
16-> (Erosion[#,DiskMatrix[4]]&),
17-> (Opening[#,DiskMatrix[4]]&),
18->(Closing[#,DiskMatrix[4]]&),
19->DistanceTransform,
20-> InverseDistanceTransform,
21-> (HitMissTransform[#,{{1,-1},{-1,-1}}]&),
22->(TopHatTransform[#,5]&),
23->(BottomHatTransform[#,5]&),
24-> (MorphologicalTransform[Binarize[#],Max]&),
25-> (MorphologicalTransform[Binarize[#],"EndPoints"]&),
26->MorphologicalGraph,
27->SkeletonTransform,
28->Thinning,
29->Pruning,
30-> MorphologicalBinarize,
31-> (ImageAdjust[DerivativeFilter[#,{1,1}]]&),
32-> (GradientFilter[#,1]&),
33-> MorphologicalPerimeter,
34-> Radon
|>;
reference110=BlockRandom[SeedRandom["110"];Image[CellularAutomaton[110,RandomInteger[1,400],400]]];
IFData[n_Integer]:=Lookup[imagefunctions,n,Identity]
IFData["Count"]:=Length[imagefunctions]
IFData[All]:=imagefunctions
Note: This function groups together several image filtering fuctions; it was used to simplify the exploration of functions to be used in the classifier. *This function was written by the the Wolfram team, but was slightly modified for this project.
propertyVector function (this function automatically evaluates all the prior necessary code needed to create the classify functions): propertyVector[property_]:={walkingvector=N@Flatten[UpToMeasurements[#,property,1]]&/@IFData[6]/@(Spectrogram[#,SampleRate->10,FrameTicks->None,Frame->False,Ticks->None,FrameLabel->None]&/@walk);
jumpingvector=N@Flatten[UpToMeasurements[#,property,1]]&/@IFData[6]/@(Spectrogram[#,SampleRate->10,FrameTicks->None,Frame->False,Ticks->None,FrameLabel->None]&/@jump);
standingvector=N@Flatten[UpToMeasurements[#,property,1]]&/@IFData[6]/@(Spectrogram[#,SampleRate->10,FrameTicks->None,Frame->False,Ticks->None,FrameLabel->None]&/@stand);
runningvector=N@Flatten[UpToMeasurements[#,property,1]]&/@IFData[6]/@(Spectrogram[#,SampleRate->10,FrameTicks->None,Frame->False,Ticks->None,FrameLabel->None]&/@run);
wavingvector=N@Flatten[UpToMeasurements[#,property,1]]&/@IFData[6]/@(Spectrogram[#,SampleRate->10,FrameTicks->None,Frame->False,Ticks->None,FrameLabel->None]&/@wave);
stairsvector=N@Flatten[UpToMeasurements[#,property,1]]&/@IFData[6]/@(Spectrogram[#,SampleRate->10,FrameTicks->None,Frame->False,Ticks->None,FrameLabel->None]&/@stairs);
walkingvectortest=N@Flatten[UpToMeasurements[#,property,1]]&/@IFData[6]/@(Spectrogram[#,SampleRate->10,FrameTicks->None,Frame->False,Ticks->None,FrameLabel->None]&/@testwalk);
jumpingvectortest=N@Flatten[UpToMeasurements[#,property,1]]&/@IFData[6]/@(Spectrogram[#,SampleRate->10,FrameTicks->None,Frame->False,Ticks->None,FrameLabel->None]&/@testjump);
standingvectortest=N@Flatten[UpToMeasurements[#,property,1]]&/@IFData[6]/@(Spectrogram[#,SampleRate->10,FrameTicks->None,Frame->False,Ticks->None,FrameLabel->None]&/@teststand);
runningvectortest=N@Flatten[UpToMeasurements[#,property,1]]&/@IFData[6]/@(Spectrogram[#,SampleRate->10,FrameTicks->None,Frame->False,Ticks->None,FrameLabel->None]&/@testrun);
wavingvectortest=N@Flatten[UpToMeasurements[#,property,1]]&/@IFData[6]/@(Spectrogram[#,SampleRate->10,FrameTicks->None,Frame->False,Ticks->None,FrameLabel->None]&/@testwave);
stairsvectortest=N@Flatten[UpToMeasurements[#,property,1]]&/@IFData[6]/@(Spectrogram[#,SampleRate->10,FrameTicks->None,Frame->False,Ticks->None,FrameLabel->None]&/@teststairs);}
Training:=trainingSet=<|"walking"->walkingvector,"running"->runningvector,
"standing"-> standingvector,
"jumping"-> jumpingvector,
"waving"-> wavingvector,
"stairs"-> stairsvector|>;
Test:=testSet=<|"walking"->walkingvectortest,"running"->runningvectortest,
"standing"-> standingvectortest,
"jumping"-> jumpingvectortest,
"waving"-> wavingvectortest,
"stairs"-> stairsvectortest|>;
Example code for the acceleration data acquisition from image processing: images=Import["$path"]
motionData=
Count[#,1]&/@
(Flatten[
ImageData[Binarize[ImageSubtract[ImageSubtract[#[[1]],#[[2]]],ImageSubtract[#[[2]],#[[3]]]]]]&/@
Partition[images,3,1],1])
*Note: before this code can be used, the backgrounds of the frames of the video have to be removed, and the image has to be binarized as much as possible (some examples will be shown in the next section).
Example code for the retrieval of raw data from DataDrop: rawData=Values[Databin["Serial#", {#}]];
data=Flatten[rawData["(xacc/yacc/zacc)"]];
**Please feel free to contact me or comment if you are interested in the rest of the code ( uploading the C code to the Arduino, the manufacturer's code for the accelerometer, C code switch that lets Mathematica communicate with the Arduino, and the Wolfram Language code used to start each loop in the switch that retrieves data ). Also, I could send the classify function, or any other information that I might have left out; all suggestions welcome.
|


