I have the following Linear State Space Model. It is pasted in Normal form for it to be readable.
provalin={{{0, 1, 0, 0, 0, 0, 0, 0, 0, 0, 0, 0}, {-355743., -2708.82,
   4.38556*10^6, -23134.7, 3.24779*10^7, 252220., 1.9571*10^8,
   1.54331*10^6, 1.3344*10^9, 1.04062*10^7, 195127., -60114.7}, {0, 0,
    0, 1, 0, 0, 0, 0, 0, 0, 0,
   0}, {-1740.54, -2.07579, -37052.7, -188.127, 124023., 961.386,
   2.47582*10^6, 19977.9, 1.53934*10^7,
   121345., -5620.58, -784.516}, {0, 0, 0, 0, 0, 1, 0, 0, 0, 0, 0,
   0}, {206.237, 0.144667, 0, 0, -20690.5, -378.64, 0, 0, 0, 0, 0,
   0}, {0, 0, 0, 0, 0, 0, 0, 1, 0, 0, 0, 0}, {0, 0, 291.405, 0.45, 0,
   0, -18814.8, -359.96, 0, 0, 0, 0}, {0, 0, 0, 0, 0, 0, 0, 0, 0, 1,
   0, 0}, {0, 0, 0, 0, 0, 0, 0, 0, -20110., -372.677, 0, -1.}, {0, 0,
   0, 0, 0, 0, 0, 0, 0, 0, 0, 1}, {100.113, 0.0743233, 3035.71,
   7.23123, 16113., 124.954, 272165., 2192.23, 1.70504*10^6,
   13428.4, -547.949, -86.0336}}, {{0}, {449.745}, {0}, {-0.412829}, \
{0}, {0}, {0}, {0}, {0}, {0}, {0}, {0.00736309}}, {{0, 0, 0, 0, 0, 0,
   0, 0, 0, 0, 1, 0}}, {{0}}};
I've tried to construct the PSD with the following code.
slv = OutputResponse[
   StateSpaceModel[provalin], {0.1, 0, 0, 0, 0, 0, 0, 0, 0, 0, 0, 0}, {t, 0, 200}];
listat = Flatten[Table[slv /. t -> tt, {tt, 0, 200, 0.1}]];
Periodogram[listat, ScalingFunctions -> "Absolute"]
I've obtained this way the following plot:
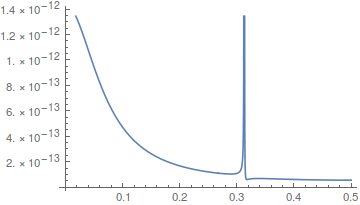
Though I expected to have only peaks without that initial slope. How is it? Am I wrongly setting the PSD? What are the right strategies to get this done cleanly?


