Message Boards Message Boards

Apply four color theorem to the map of Florida?

I'm attempting to apply the Four Color Theorem to a map of Florida and I'm following an example available among the standard collection of examples located at: ref/GeoGraphics; "Neat Examples" (provided by my Mathematica software). Unfortunately; the following:

EntityProperty["AdministrativeDivision", "BorderingCounties"] 

doesn't work when I evaluate it using my Mathematica software. I found an alternative way to get around this difficulty and I can apply the four color theorem to subareas of the map of Florida but, the same code that I use for the subareas will not work for the whole state. I have built the attached Mathematica notebook explaining my problem in detail. Thank you for your help!

Attachments:
8 Replies

Here's a very compact solution using IGraph/M's IGVertexColoring function.

counties = EntityList@EntityClass["AdministrativeDivision", "USCountiesFlorida"];

borderingQ[c1_, c2_] := MemberQ[c1["BorderingCounties"], c2]

graph = RelationGraph[borderingQ, counties];

GeoGraphics@
 MapThread[{GeoStyling[#2], Polygon[#1]} &, {counties, ColorData[97] /@ IGVertexColoring[graph]}]

Mathematica graphics

?IGVertexColoring

IGVertexColoring[graph] returns a vertex colouring of graph.

Currently this function does not guarantee a minimum colouring, but it does well here. You can see the fifth colour (purple) around the quintipoint in the South East.

POSTED BY: Szabolcs Horvát

Thank you Chris Hurst for your discussion about quintipoints and your incredible code to build the map of the USA. I wish I had read your posts before learning about quintipoints the hard way! And thank you Aeyoss Antelope for your wonderful sense of humor! Google (and other corporate) interviewees; beware about your "IQ" ; i.e., beware about the "Infamous Quintipoint" question! LOL.

Thanks for this! I forgot about the quintipoint, making this into a Google Corp interview question...

Interviewer: How would you make a four-color map of the counties of the state of Florida?

Applicant: It is not possible because of the quintipoint! Hahaha

POSTED BY: Aeyoss Antelope
Posted 7 years ago

There's a 'quintipoint' in Florida, which breaks the ability to have a 4 color map.

See here for more info: http://community.wolfram.com/groups/-/m/t/932548.

About a year ago I did this for all US counties: enter image description here

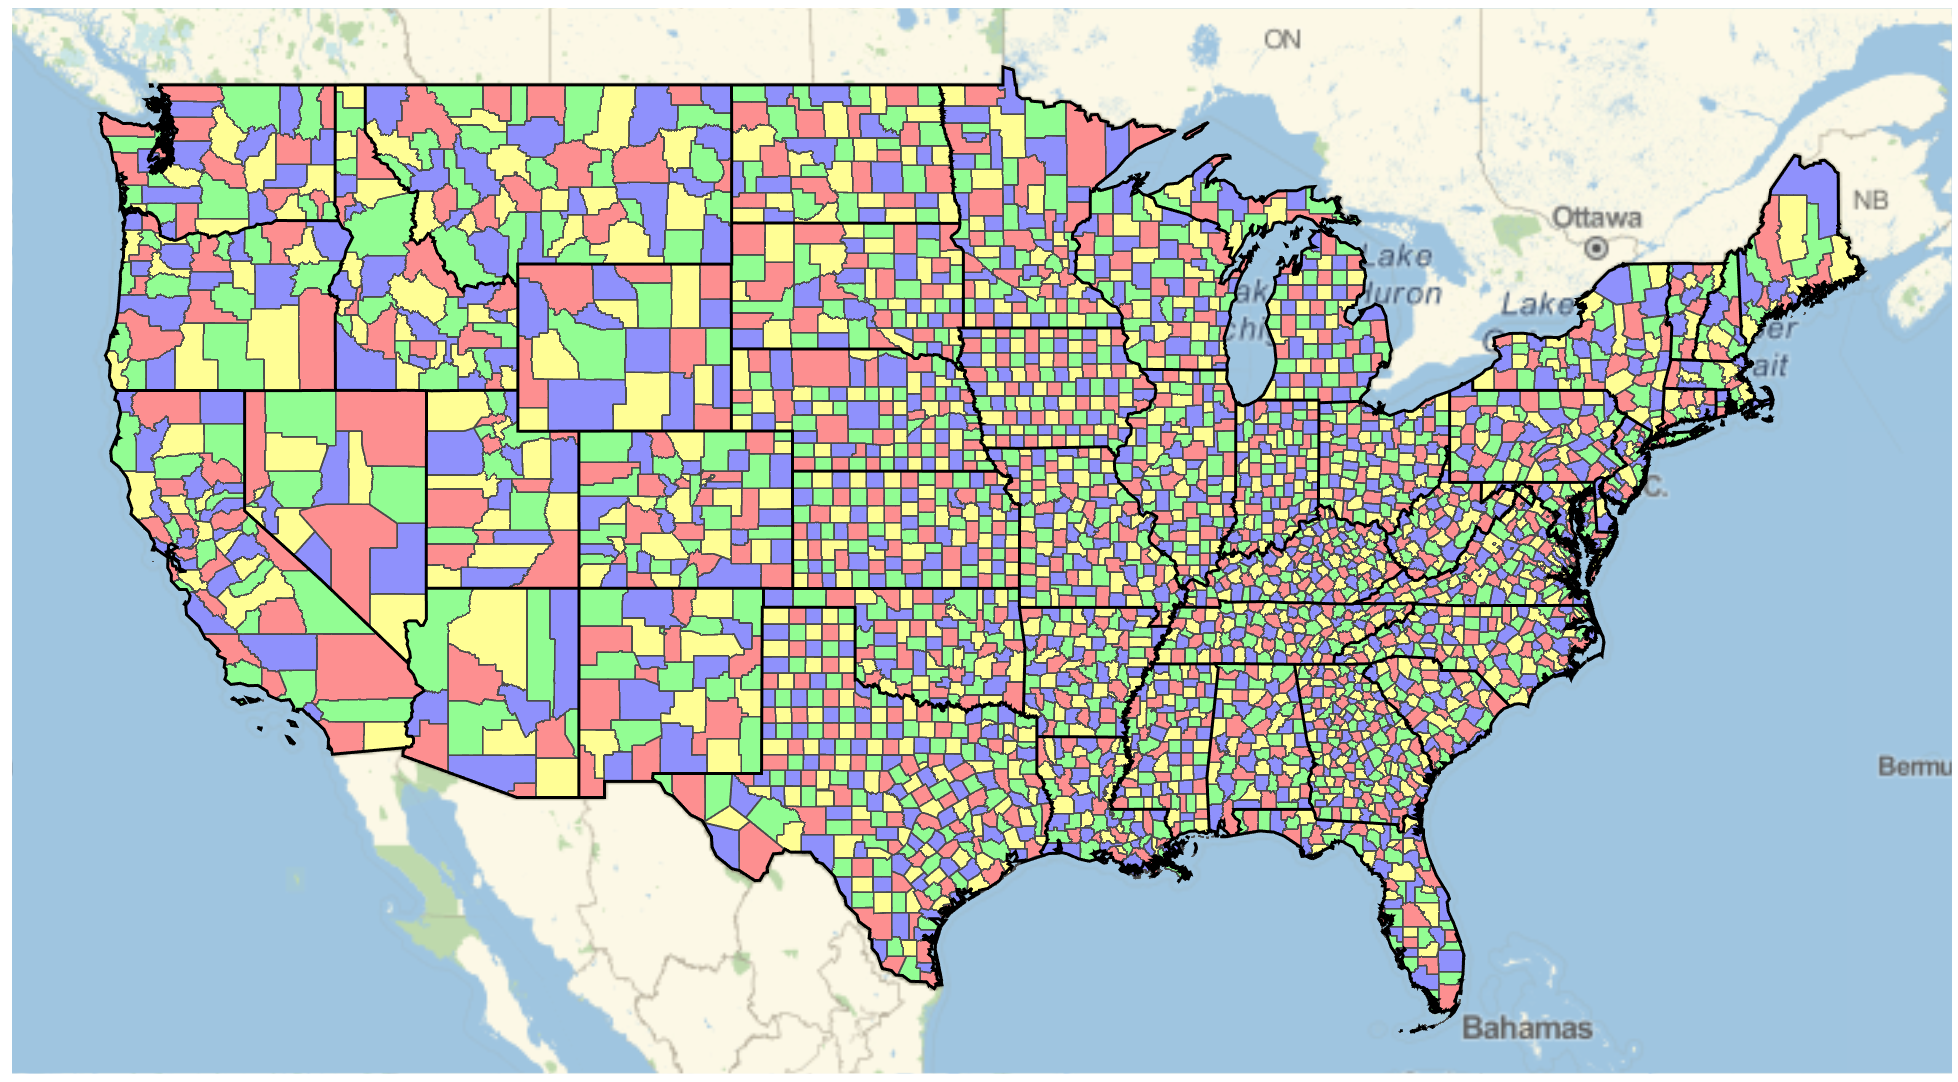
Here's the code I used. Note how I manually tweaked the quintipoint.

states = DeleteCases[
   Entity["Country", "UnitedStates"][
    EntityProperty["Country", "AdministrativeDivisions"]], 
   s_ /; ! FreeQ[s, "Alaska" | "DistrictOfColumbia" | "Hawaii"]];

$triple = 
  Entity["AdministrativeDivision", {"PalmBeachCounty" | 
     "GladesCounty" | "OkeechobeeCounty", "Florida", "UnitedStates"}];

counties = 
  Join @@ (EntityList[
       EntityClass["AdministrativeDivision", 
        "USCounties" <> CanonicalName[#][[1]]]] & /@ states);
nassoc = EntityValue[counties, "BorderingCounties", 
   "EntityAssociation"];
neighbors = {#, 
     Intersection[nassoc[#] /. _Missing -> {}, counties]} & /@ 
   counties;
neighbors = 
  neighbors /. {c : $triple, n_} :> {c, DeleteCases[n, $triple]};
toColor[tf_] := <|{False, False} -> Red, {False, True} -> 
    Blue, {True, False} -> Green, {True, True} -> Yellow|>[tf]
eqs = And @@ (Flatten[
     Function[{c, n}, 
       BooleanConvert[Xor[x[c], x[#]] || Xor[y[c], y[#]], "CNF"] & /@ 
        n] @@@ neighbors]);
MaxMemoryUsed[
  solution = 
   Join[First[
     FindInstance[eqs, Union[Cases[eqs, _x | _y, \[Infinity]]], 
      Booleans]],
    Flatten[{x[#] -> True, y[#] -> True} & /@ 
      Flatten[Cases[neighbors, {_, {}}]]]]] // AbsoluteTiming
coloring = (#[[1, 1, 1]] -> Lighter@Lighter@toColor[Last /@ #]) & /@ 
    Partition[SortBy[solution , #[[1, 1]] &], 2]; // Quiet

(* {206.017, 20929584} *)

GeoGraphics[{
  {EdgeForm[{AbsoluteThickness[0.1], 
     GrayLevel[0.3]}], {GeoStyling[#2], Polygon[#1]} & @@@ coloring},
  {EdgeForm[{AbsoluteThickness[1.5], Black}], FaceForm[], 
   Polygon[EntityList[
     EntityClass["AdministrativeDivision", "ContinentalUSStates"]]]}
  }, GeoProjection -> "Mercator"]
POSTED BY: Greg Hurst

@Aeyoss Antelope: Yes Aeyoss; that is indeed the example that I'm emulating; with counties in Florida instead of countries in Europe. Thank you.

Did you already try this?

Find a Four-Coloring of a Map of Europe

POSTED BY: Aeyoss Antelope

@Joel Gilly Thank you for responding to my query. I have no trouble getting the list of counties as you described. The trouble occurs when attempting to color the counties as described in another Mathematica notebook located at: http://community.wolfram.com/groups/-/m/t/1097057 Thank you for your help!

Posted 7 years ago

I am going to assume that in your solution you want a nested list of string values that represent the Counties with which you are interested. In that case, you will need to apply the EntityValue function to a valid Entity Data Types. However, you will first need to obtain an Entity Class from your strings that represent the Entity Types you seek.

xx = EntityValue[
   EntityClass["AdministrativeDivision", "USCountiesFlorida"], 
   "BorderingCounties"];

EntityValue[#, "Name"] & /@ xx
POSTED BY: Joel Gilly
Reply to this discussion
Community posts can be styled and formatted using the Markdown syntax.
Reply Preview
Attachments
Remove
or Discard

Group Abstract Group Abstract